Hi Team,
I want to prepare a report that are in status ToDo, In Progress for each month. If the issue is moved from ToDo to In Progress & Closed in Same month, then it should take last status and should not show count in In Progress.
I have another issue that Report shows only the issue which are opened now. I would like to take a report of past year/month, which are closed, but the issue history is not showing count in report.
I understand that I could use the Calculated Measure which I tried, but it doesn’t give correct result. I used below expression and tried some combination, but it doesn’t give correct result
(
[Measures].[Issues history],
[Transition Status].[In Progress]
)
You are pretty much on the right track!
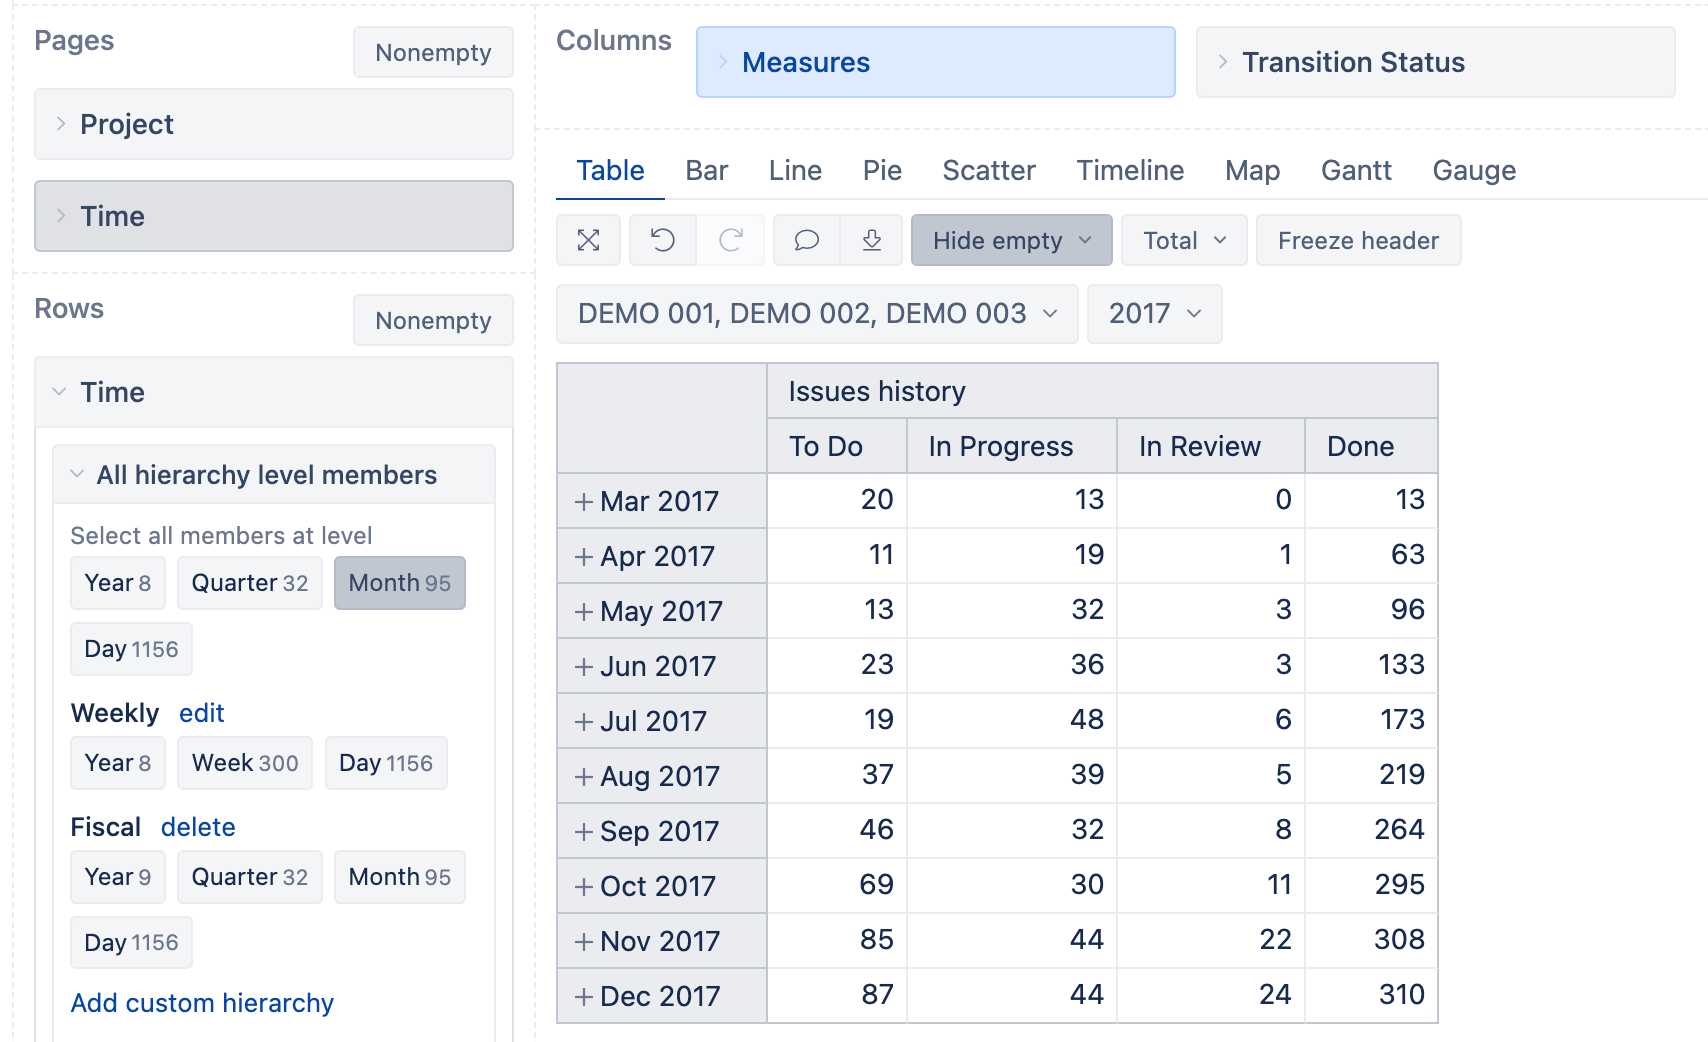
The Issues history measure, when used together with the Transition Status and Time dimensions, will return the historic Status that the issue had at the end of your chosen period. For example, if you have Months in Rows, you will see the number of issues in each status that these issues had at the end of that specific month.
To create this report, select the Issues history measure from the Measures dimension, and add the Transition Status dimension to Columns, and Time dimension with Month members selected in Rows.
To select only specific Statuses, use the “Search and bookmark” option in the Transition Status dimension. The order of the statuses then will be the same as the order in which you select these bookmarks.
This report will show historic statuses for all issues, regardless of whether they are closed or open now.
Hi,
I would like to do the same, but with the new “done” in the last column (not the cumulative).
Can we do that ?
In your example, it would be : 13, 50, 33, 37,…
Best regards,
Ludovic
CASE WHEN
  [Transition Status].CurrentHierarchyMember.Name = "Done"
THEN
  [Measures].[Issues history]
  -
  PreviousRowValue([Measures].[Issues history])
ELSE
  [Measures].[Issues history]
END
And then, use this custom measure instead of the “Issues history” measure in your report.
Could you please share what you would like to show in this report?
The better you explain what exactly you would like to achieve, the better I can build a formula that would fit your use case!
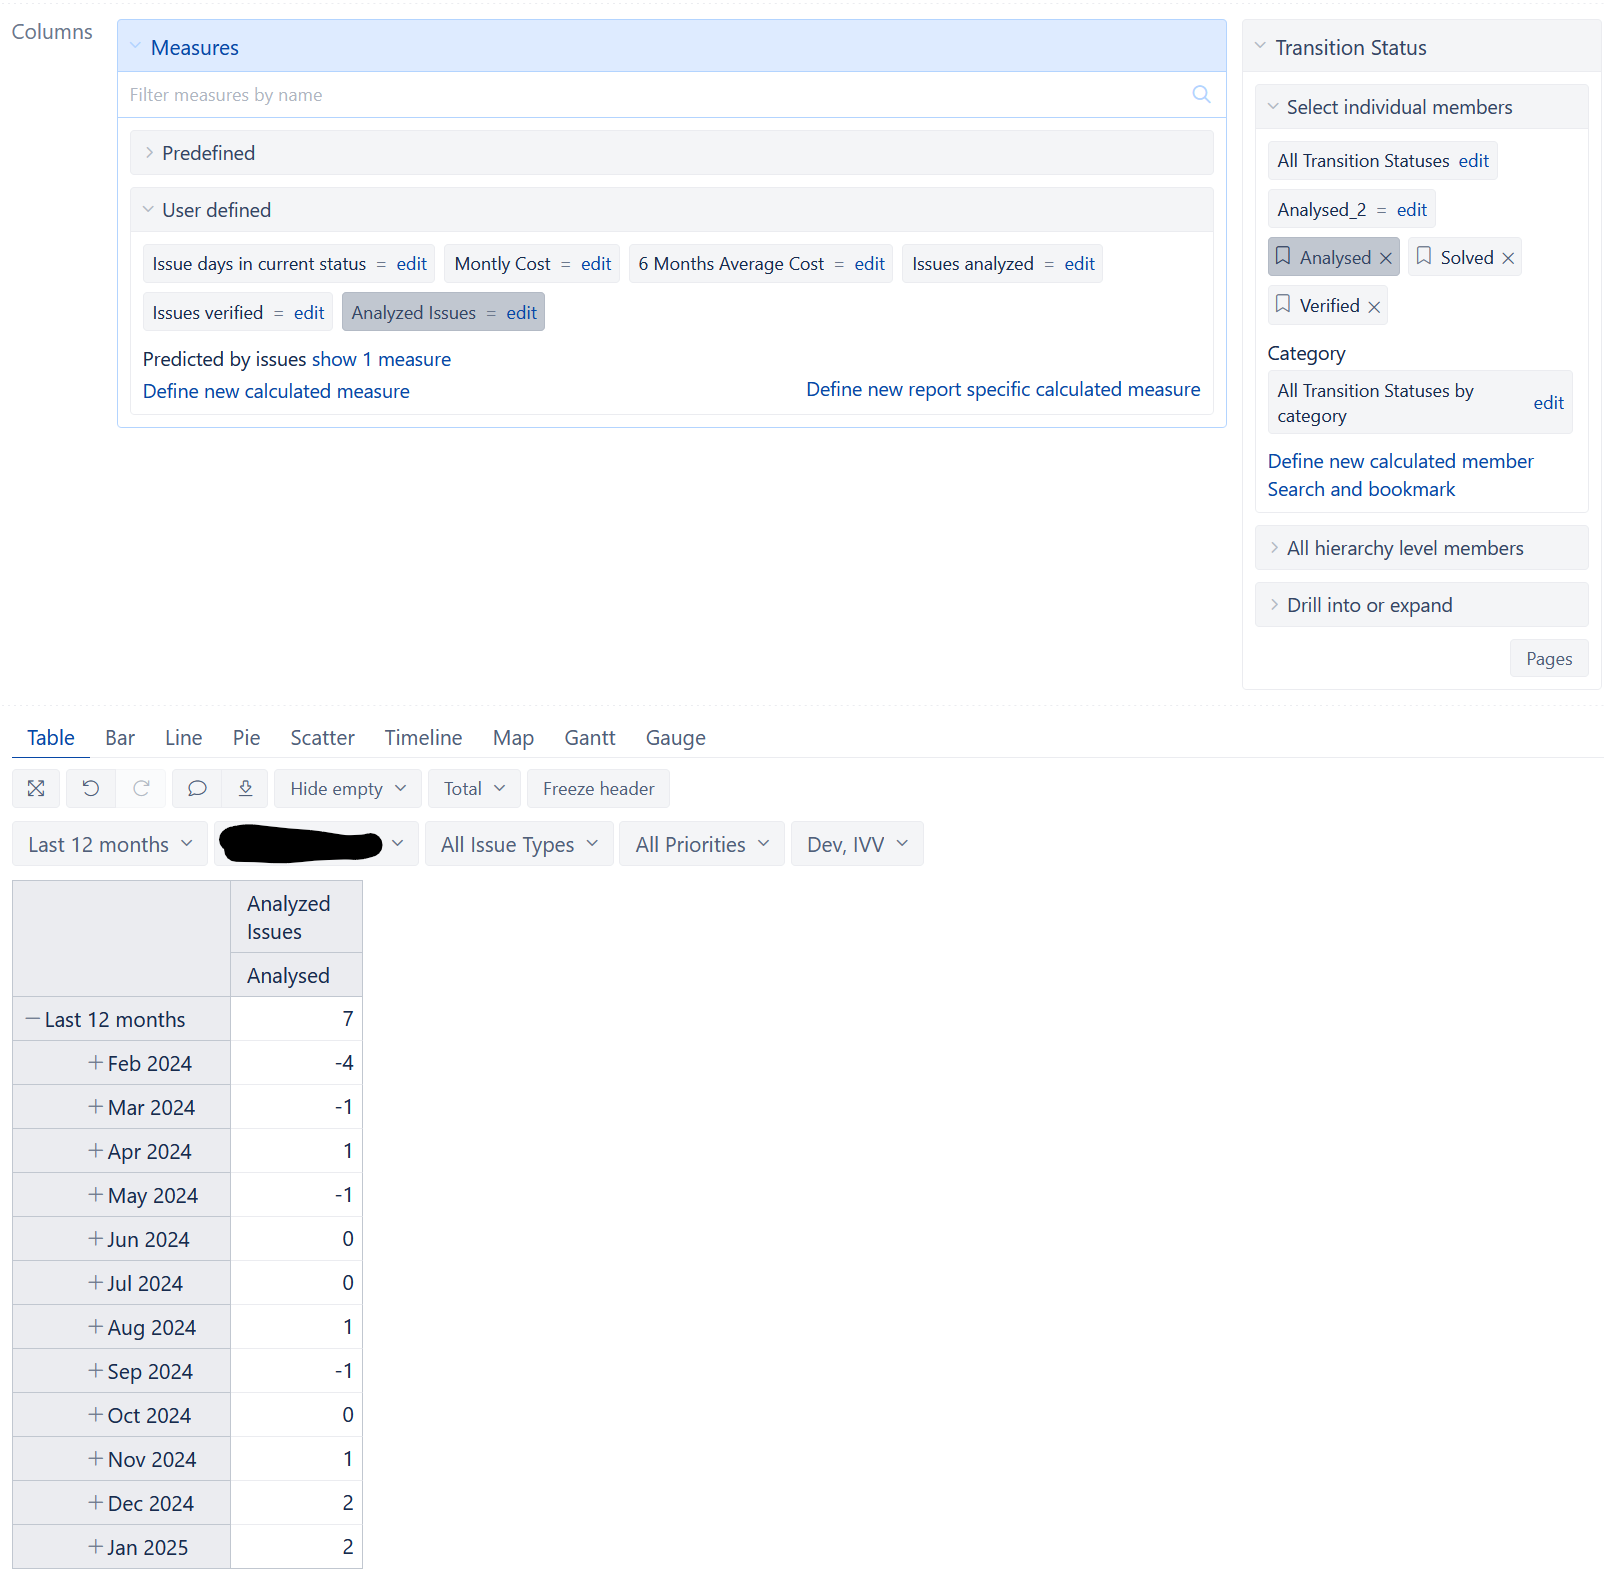
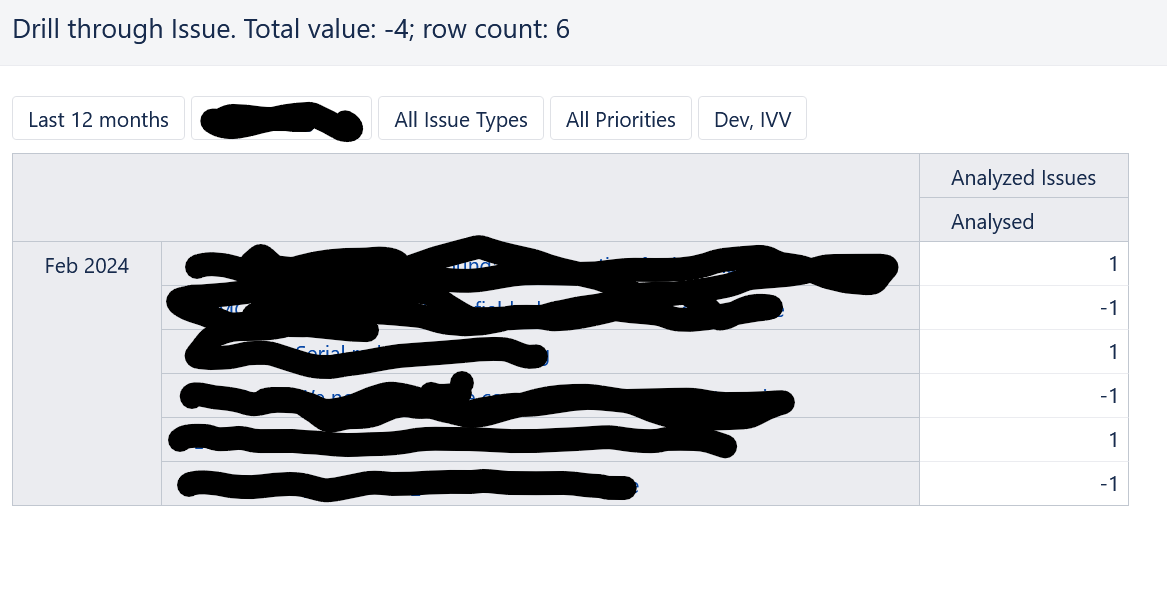
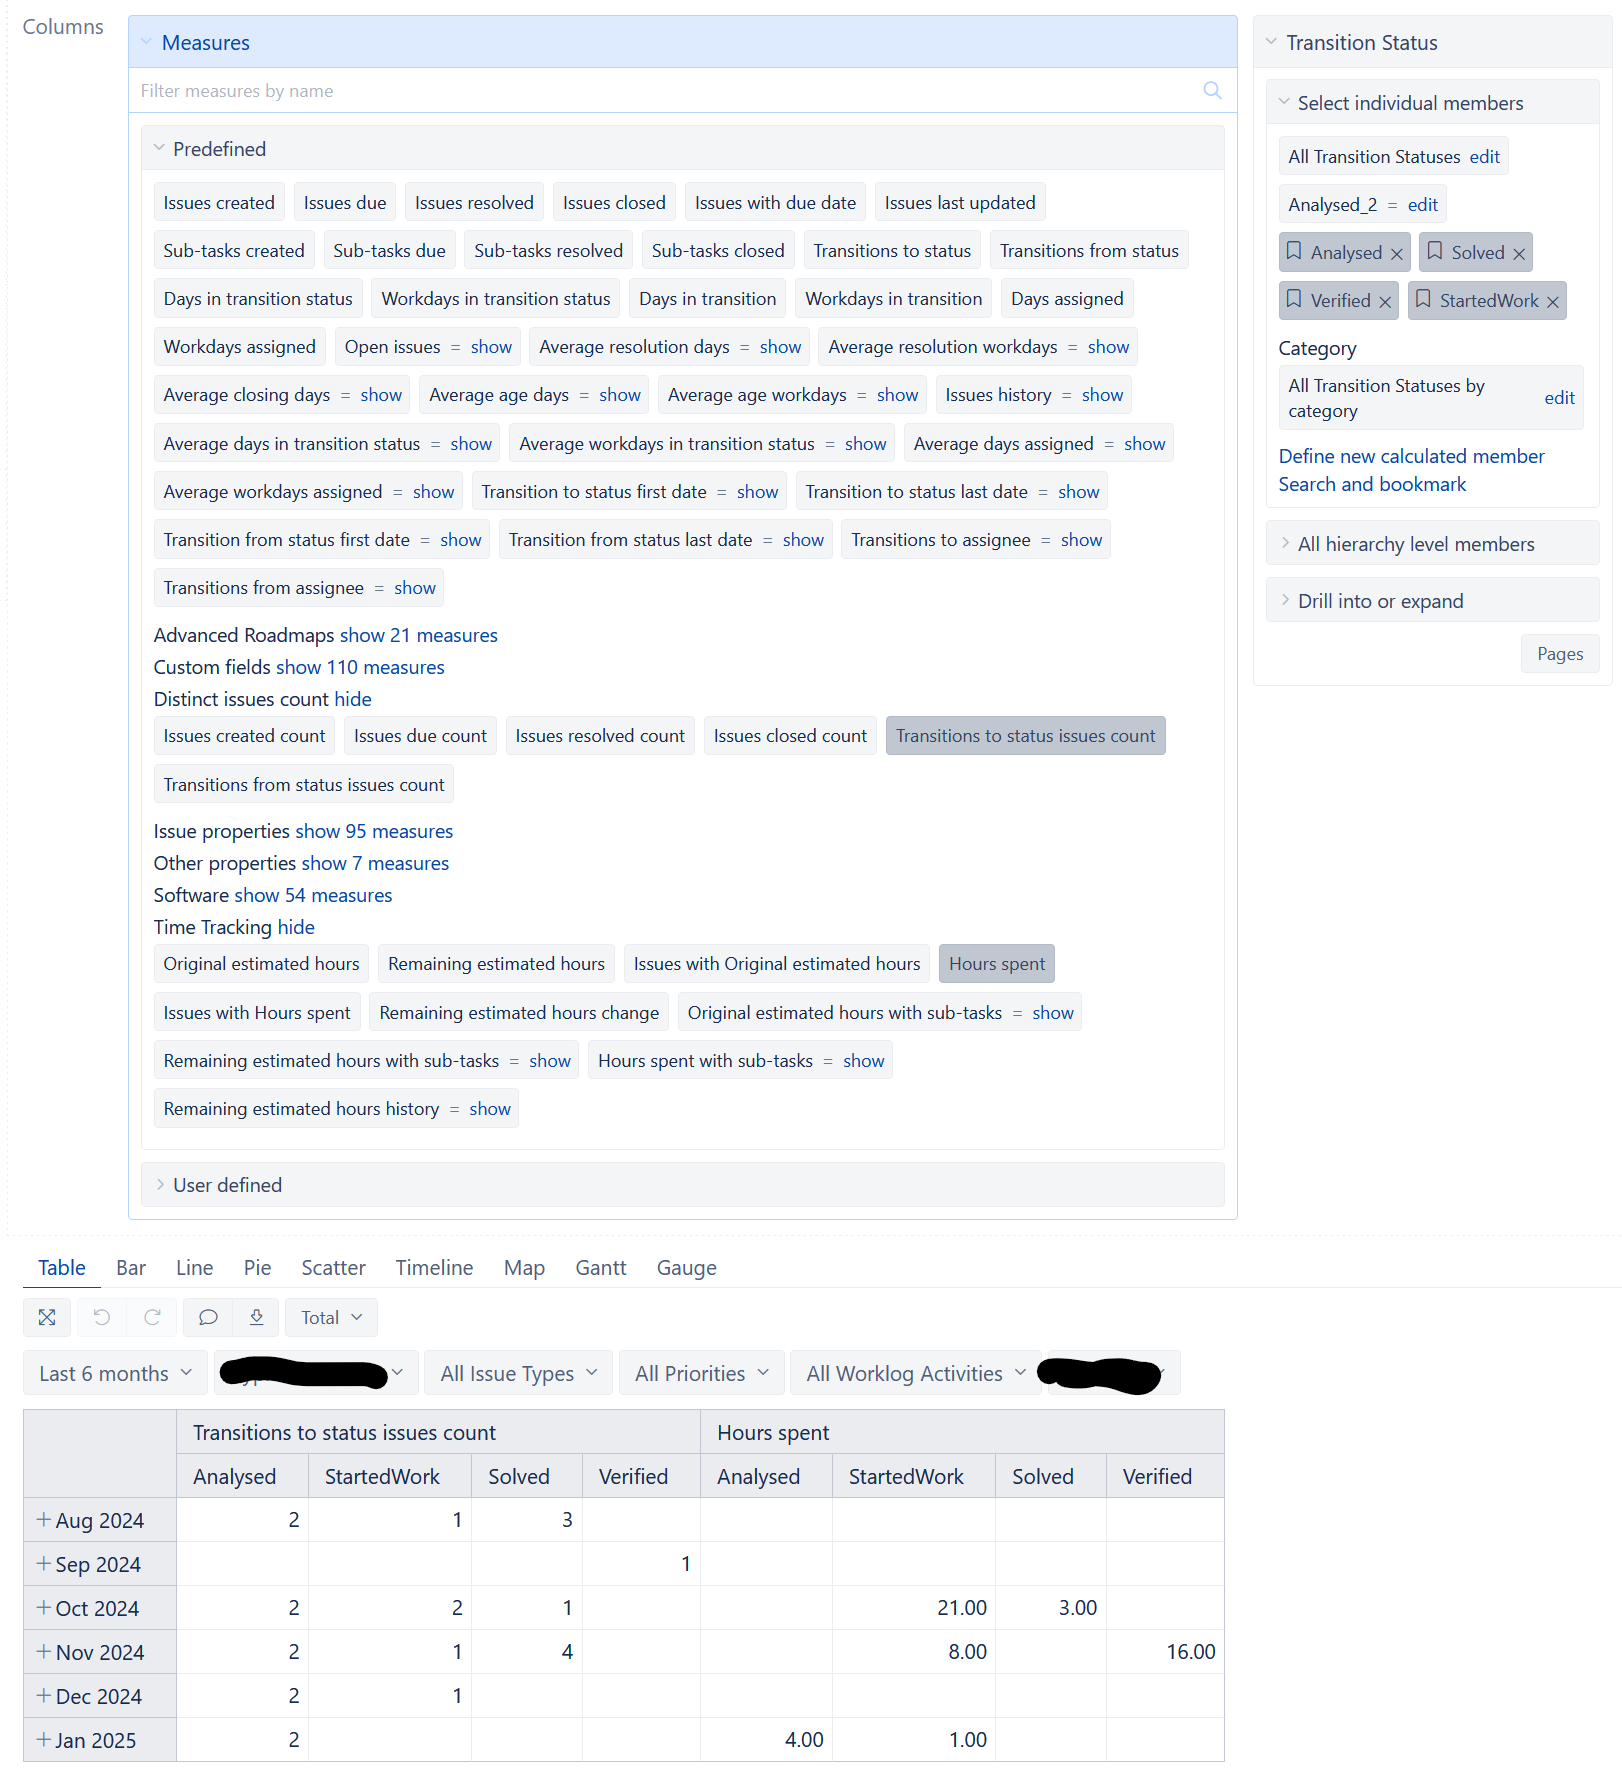
I was able to correct the chart next day, by changing selecting in Measure “Transitions to status issue count”, instead of my created “Analyzed Issues”.