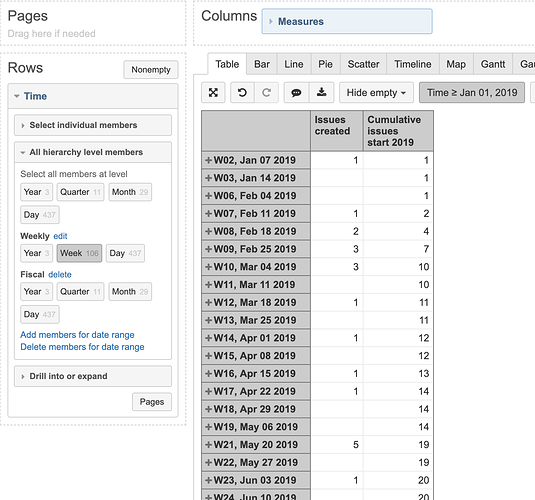
I am filtering my chart from march 2019 onwards and plotting a cumulated numbers on the same chart.
cumulated formula picks up the data since beginning. 2016/18 onwards.
is there a way i can customize the cumulated calculation to start the calculation from a given date and ignore all previous data before the date specified in filter/provided manually.
Hi,
Yes, you can create the custom cumulative by selecting the set of time members with the range:
Sum(
  {[Time].CurrentHierarchyMember.Level.Datemember("Jan 01, 2019"):
   [Time].CurrentHierarchyMember
  },
  [Measures].[Issues created]
)
This calculation uses a universal formula that works with all the time dimension hierarchies and allows creating the report like this:
We expect to release a new version of eazyBI (5.0) in coming weeks where such calculations would be possible to create automatically, without the custom formulas.
Kindly,
