Dear,
I want to filter the SW(Others) component firstly and then calculate it. How to code the measure?
Aggregate(
Filter(
[Project].[Component].Members,
[Project].CurrentMember.name MATCHES ‘SW(Others)’
Dear,
I want to filter the SW(Others) component firstly and then calculate it. How to code the measure?
Aggregate(
Filter(
[Project].[Component].Members,
[Project].CurrentMember.name MATCHES ‘SW(Others)’
Hi @Charles
You are on the right path.
First, you would create a new calculated member in “Project” dimension
Aggregate(
Filter(
[Project].[Component].Members,
[Component].CurrentMember.Name MATCHES 'SW(Others)'
))
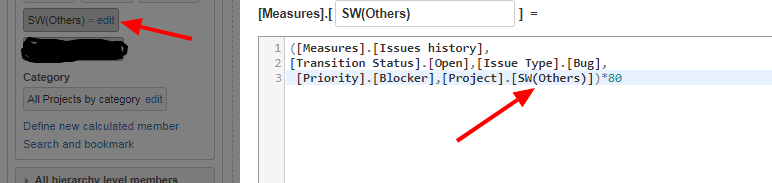
Then you could update your calculated measure with the new member from “Project” dimension
(
[Measures].[Issues history],
[Transition Status].[Open],
[Issue Type].[Bug],
[Priority].[Blocker],
[Project].[New member]
)*80
Martins / eazyBI support
Hi Martin,
Thank you for your reply.
I have created new calculation in project and new measure. But chart have not displayed any data. Something wrong in my measure?
Hi,
Please try to avoid using () in calculated member names.
Try choosing name “SW Others” for your calculated member name.
Martins / eazyBI support
Hi Martins,
The method will be successfully and implement to all projects.But I want the calculation is ONLY for one project. so I want to create the measure to filter the project.
Do you have another method using measure dimension to filter to SW Other component, then sum the total data with priority?
Hi,
In this case you can create a new calculated member in “Project” dimension for just one project.
Aggregate(
Filter(
[Project].[Component].Members,
[Project].CurrentMember.Parent is [Project].[Only Project Name]
AND
[Project].CurrentMember.Name MATCHES 'SW(Others)'
))
Then you can use this new member from “Project” dimension in your calculation.
It should aggregate component SW Others only from one project.
The method with tuples has proven itself over the years.
And I am not quite sure I understand the use-case in your second sentence.
Perhaps you can share more details on how you sum total data with priority.
Martins
Hi Martin,
Thank you for your reply.
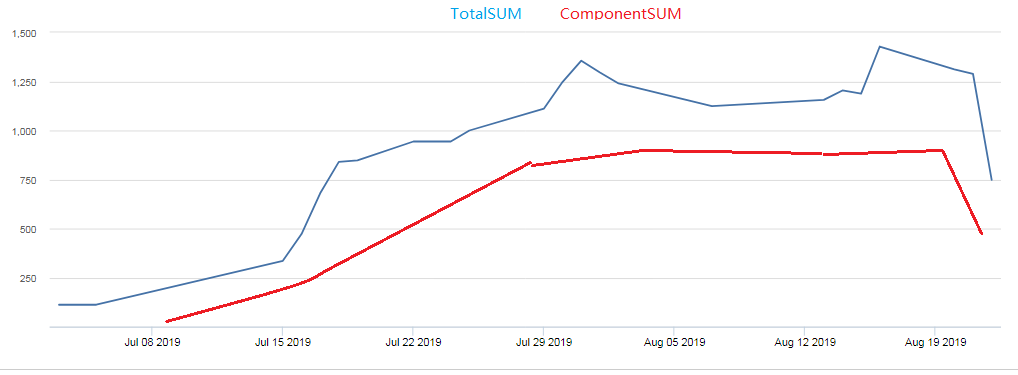
Let me clarify my requirement as detailed. We have more than 100 Projects and create dashboard for each project. The project(A/B/C…) have TotalSum and ComponentSum. I want to create one dashboard to display TotalSum and ComponentSum(SW (Other),EE,HW,HDMI…) in one Timeline Chart.
The Expected like this. I have finished TotalSum. Now, I do not know how to filter the Component and display to the timeline chart.