Hello EazyBI folks,
I need your help to build a report for my mgmt., sort of a version report that also plots the trend for future to help predict when the work will end. My team is doing this in excel for now and we want to switch to EazyBI.
I need to plot the:
- Work that has already happened till today – I am plotting the “Cumulative days spent”.
- The remaining estimate getting reduced over time till today, I am plotting this via “Remaining days history” measure calculated from the “Remaining estimated hours history”
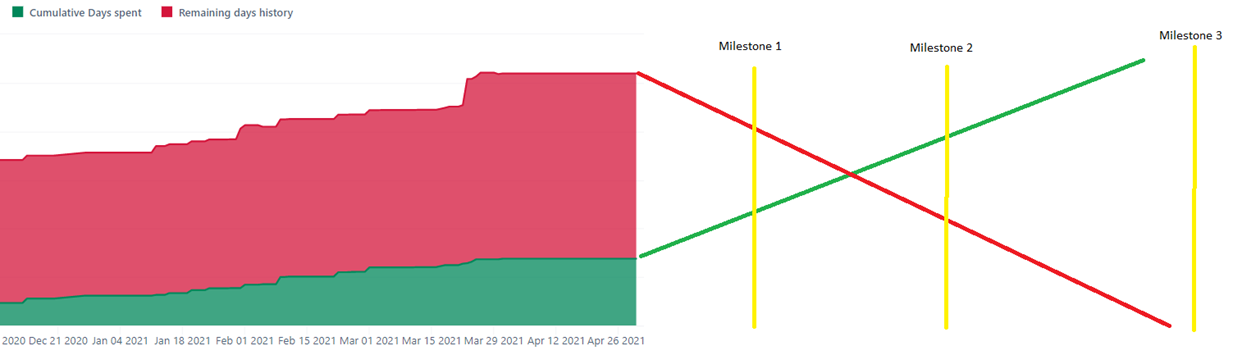
- Plot the trend for (1) in the future – red burndown trend line in below image.
- Plot the trend for (2) in the future – green burnup trend line in below image.
Something like the image below (please ignore the slope of the green and red trend lines):
The red and green area is plotted by EazyBI below and I added the lines on the right to show what I am imagining:
I’m a like a week old user for eazyBI and need your help 
I saw two reports on the demo account that may be similar, but I am unable to understand those clearly:
- Version story burndown and burnup: Issues - Jira Demo - eazyBI
- Project prediction report: Issues - Jira Demo - eazyBI
Some background on our Jira configuration:
Our Jira project is a Kanban based project used by 200+ engineers (we don’t use sprints, sorry mgmt. decision). To count velocity, we also don’t work on issue closure or story points closure per se, but rather on days spent and days remaining, because our issues tend to vary a lot in efforts (as low as 2 days or high as few months).
How can I accomplish this report:
- From what I understand, to plot the trends for future, I will need to calculate some sort of velocity. I spoke to a few folks around me and received two different suggestions - Use the average work done per week from the start of the project till now as velocity, and another being – use the average work done in the last 4 weeks as velocity. I am leaning towards using the last 4 week average as the velocity.
- How do I calculate the “Remaining estimate velocity for last 4 weeks” and “Days spent velocity for last 4 weeks”? I see the measure “Story Points Velocity 5 Sprints” in demo account but I don’t understand MDX enough to convert this measure to a work estimate or days spent based measure.
- Once the velocities measure are defined, how do I use those measures with the “Cumulative days spent” and “Remaining days history” and get the trend prediction line for the future?
Please help!
Thank you so much!
Regards,
Vikrant