Need to make a report showing how many hours total across all time issues closed during the month spent in various types of statuses.
For example, if 3 issues closed in March, then I want to get the total aggregate time each issue spent in each state. Some issues spend MONTHS in a state and I want all those hours. So if issue 1 spent two months in “waiting” then and issue 2 spent just three days in “waiting” etc. add all that time up.
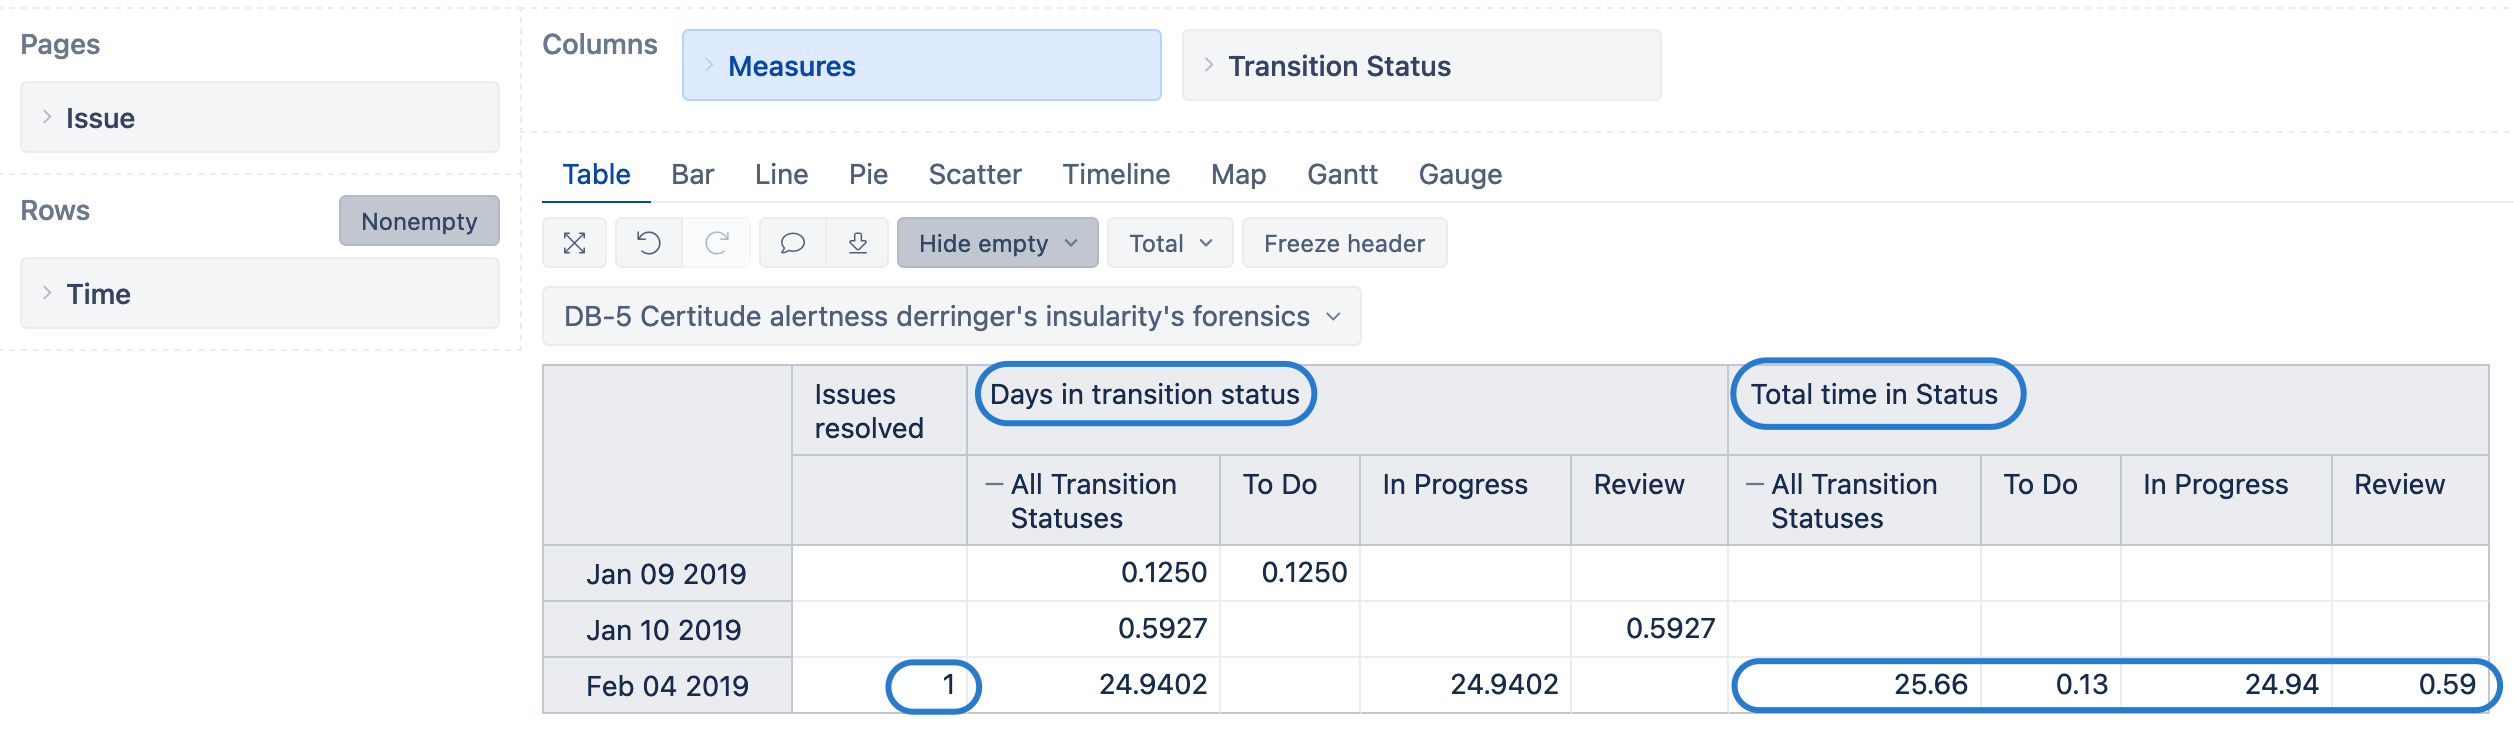
Here is the chart I’m trying to get to. The problem is the values for the hours in the statuses are way too small to be correct. It appears that the calculated measure is only counting the hours in the given time period, not the grand total.

The hours calculations are based on a custom Aggregate calculated member added to Transition Status.
I’ve put the [Transition Status].[Closed SAs] as a fixed page as that appears to provide the right starting set.
[Measures].[Total Hours by SA Team]  =

(
  [Measures].[Average days in transition status],
  [Issue Type].[Advisement],
  [Transition Status].[Awaiting SA Team]
)

Formatting Custom #,###.## h