I tried to create a control chart in Eazy BI and calculated the average using the CT1 formula.
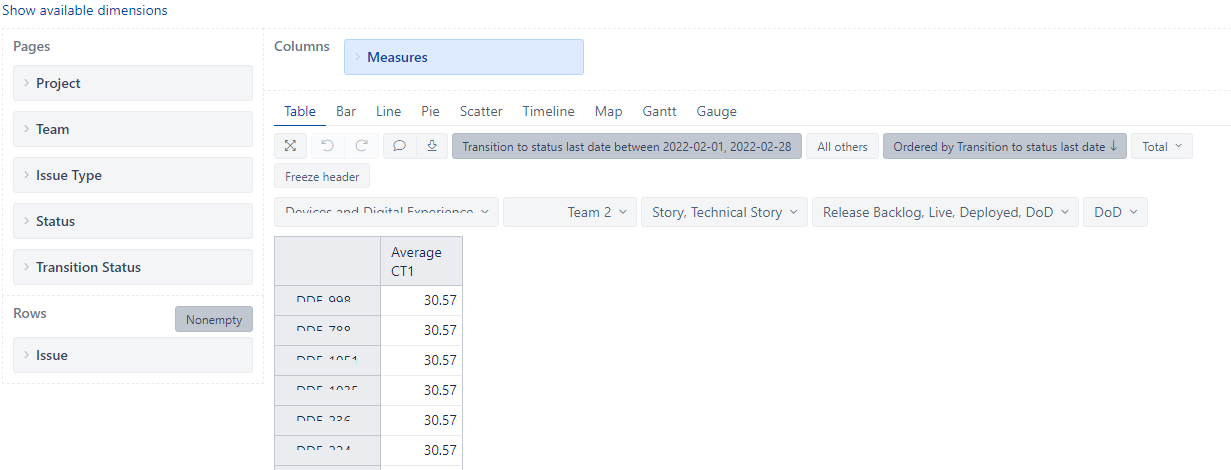
The Average Value is not displayed when All Issues is selected
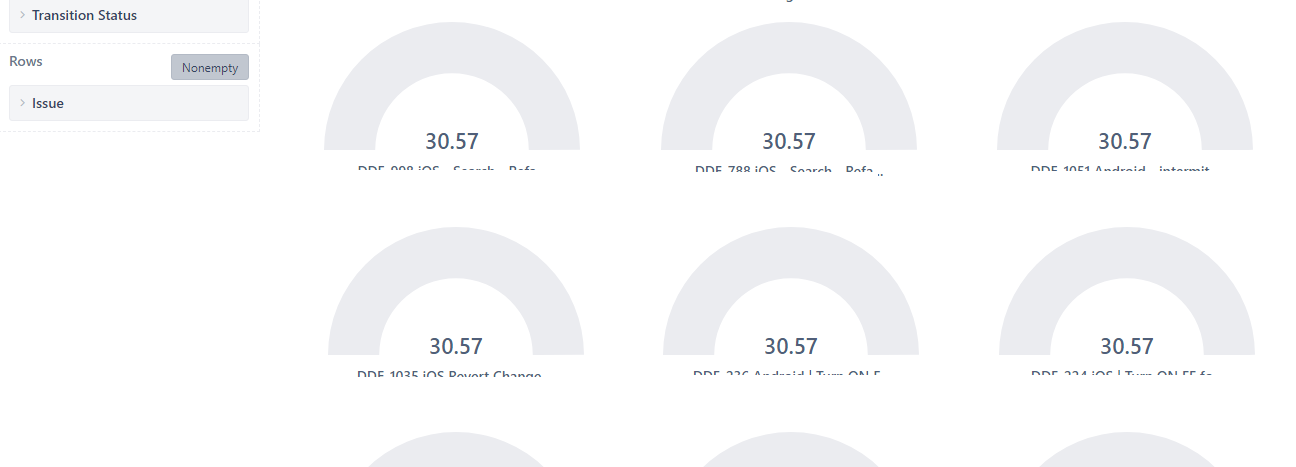
There is only one number I need to represent the report.
How to get the one Average value in report instead of using all the Issue Keys.
used CT1 Formula
DateDiffDays(
([Measures].[Transition to status first date],
[Transition status].[DoR]
) ,
– date for last transition to status ‘Status B’
([Measures].[Transition to status last date],
[Transition status].[DoD]
)
Hi @Nagaraju_T
Welcome to eazyBI community!
Thanks for sharing the screenshots; they helped a lot! When looking at your report, I see that you are filtering the column “Transition to status last date” to be between Feb 1, 2022, and Feb 28, 2022. This is why you don’t see any data when selecting “All issues” because no such date can be returned for the line “All issues.”
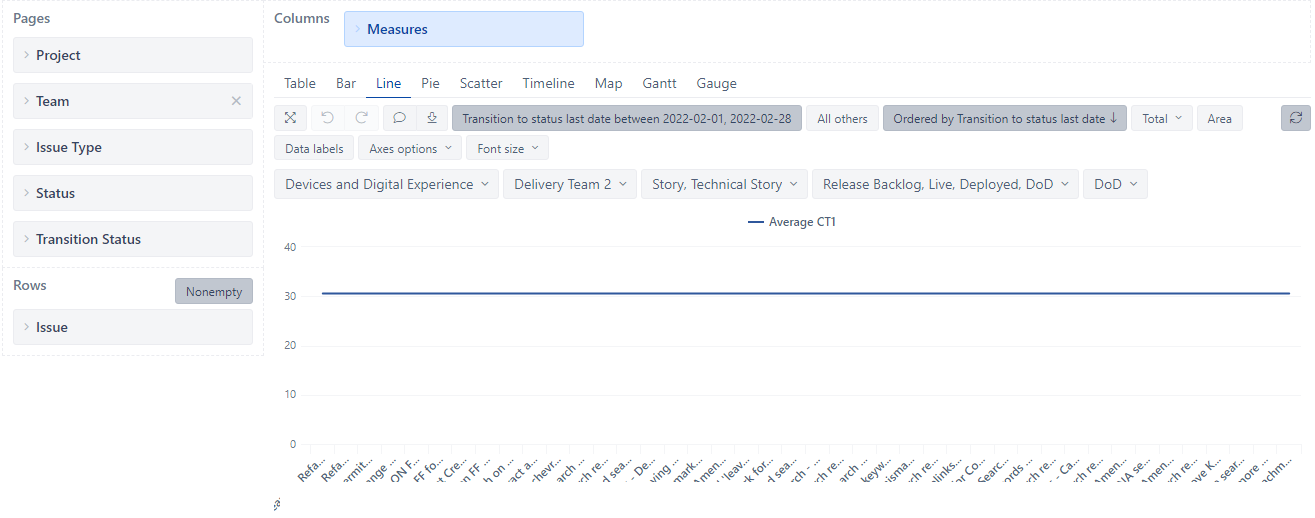
I recommend removing the filter from your toolbar and define a new calculated measure with the formula below. Then select the Time dimension in Pages. You can filter the report by required month, and the formula will calculate the average days according to the month selected
Avg(
  Filter(
      Descendants([Issue].CurrentMember,[Issue].[Issue]),
  DateInPeriod
 ([Measures].[Transition to status first date],
  [Time].CurrentHierarchyMember)
  ),
    DateDiffDays(
    ([Measures].[Transition to status first date],
    [Transition Status].[DoR]),
    ([Measures].[Transition to status last date],
    [Transition Status].[DoR])
   )
)
Best wishes,
Elita from support@eazyBI.com
1 Like