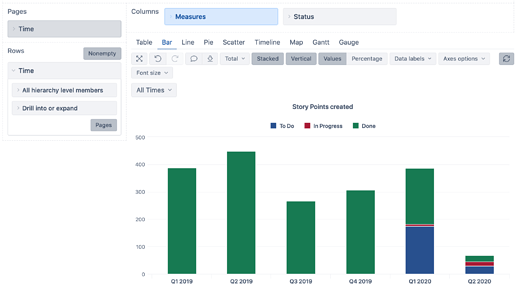
I want to group all dimension belonging to each Quarter (Q1, Q2 , Q3) , and be able to add the Group Name under each stacked bar as 2019Q1, 2019Q2 etc. Currently my chart looks like the appended screen shot.
I would suggest using both Columns and Rows for this report.
Please move Time to Rows and select Quarter level there.
Use Measure Story Points resolved on Columns. Add Status to Columns as well. The order (dimension placement in Columns) is important here.
I used Vertical Stacked chart for this setup:
This setup will allow you to set one color per each status as well. It will make easier configuration of the chart.
Daina / support@eazybi.com
Thanks @daina.tupule. Could you show-
1- how you were able to get Time in Pages AND Rows ?
2- I was hoping to get the Quarters identified via a field called FixVersion that is used to identify the Quarter. In this case what’s the solution you might recommend ?
I am basically trying to create a stacked Bar Chart to present the Features that are categorized as Planned, Unplanned Stretch(value identified on custom field called Planned Vs. Unplanned ), that were Completed in each Quarter ( value identified on Fix Version).
Any suggestions ?
You can use any dimension on Rows (Columns) and Pages. Please move the dimension to the Rows or Columns at first. Then click the button Pages in expanded dimension on Rows (or Columns). See short video in our documentation as well.
The principles on how to build the report should work for any other dimension combination as well. You can use Fix version on Rows. Check if the Fix version by name hierarchy could work there. You can use the custom field dimension Planned Vs. Unplanned representing the status on Columns.
We suggest using the selection of a particular level in All hierarchy level members of any dimension to show all values of the field in the report.
We import Fix versions as a dimension by default. Please check if the custom field Planned Vs. Unplanned is imported into eazyBI account as a dimension.
Daina / support@eazybi.com

