Hello @martins.vanags,
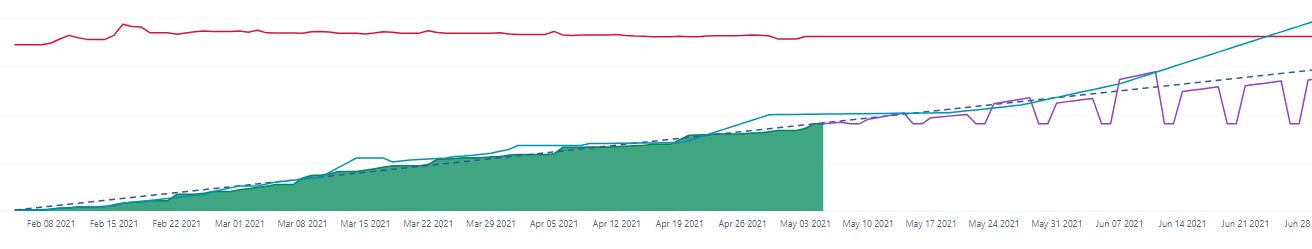
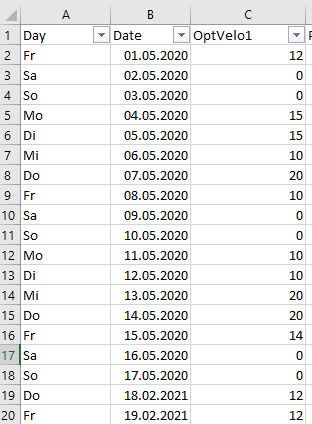
sorry I have another request quite similar to previous one. With the answer you provided me first I am now able to draw lines from starting point of graph (version start) (see blue line in example). In the excel I put total number of SP predicted per day.
Next I need to draw forecast starting from today with the already achieved storypoints and a given velocity (purple line) (which also change quite often, so it shall also be inside an excel)
I put similar excel file
I do use the same settings to import the excel and also add the default context.
Then I put a measure like
--annotations.group=Predicted
Case
when
  DateInPeriod(
    'Today',[Time].CurrentHierarchyMember)
then
   NonZero((
    [Measures].[Story Points resolved],
    [Time].CurrentHierarchy.DefaultMember))
When
 DateBetween(
    [Time].CurrentHierarchymember.StartDate,
    'Today', [Measures].[Predicted completion date])

  Then
  -- current progress
    NonZero((
    [Measures].[Story Points resolved],
    [Time].CurrentHierarchy.DefaultMember))
    +
    -- add pace for each day in future taken from the excel
    [Measures].[Velocity2 - default context - debug]


    *
    DateDiffWorkDays('Tomorrow',[Time].CurrentHierarchyMember.NextStartDate)
End
as suggested in 9. Prediction reports - #2 by daina.tupule
Unfortunately the line is jumping, especially at the weekends, it is falling down?
Can you please help me again on the measurement.
Many thanks in advance
Christian