Hello,
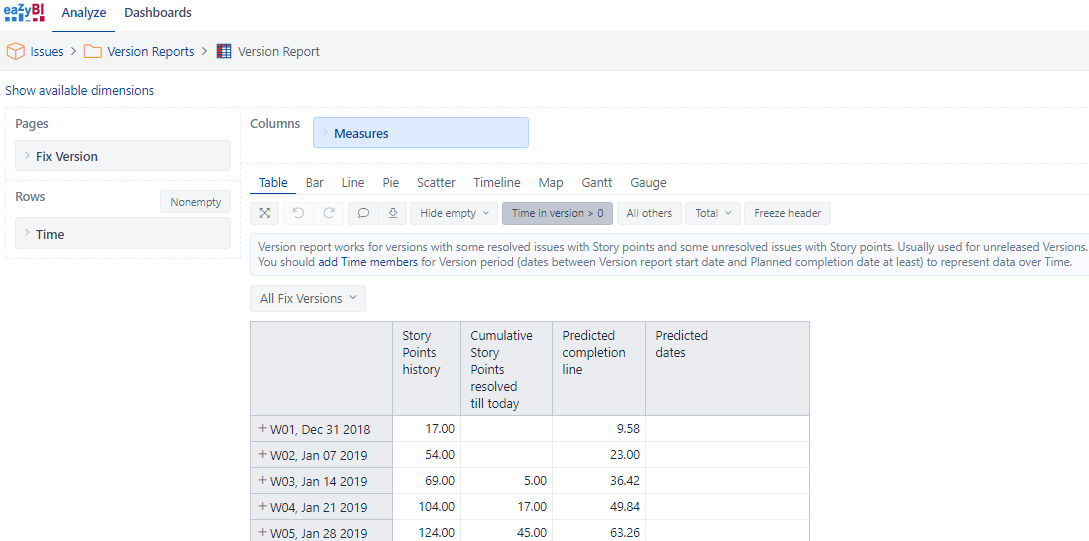
I would like to add some additional lines (for predicted team velocity) into the standard Version report.
I have used own calculated measures so far, which is working quite ok, in case you only consider linear velocity. We would like to consider different velocity per Sprint due to changes of teamsize / vacation etc.
(Yes, right for agile the goal is to consider constant velocity - but in our case this is not really the case and therefore we would like to have a varibale velocity.)
Idea is now to provide an additional excel table as 2nd data source as input. So team can easily give us information about their expected velocity inside an excel file.
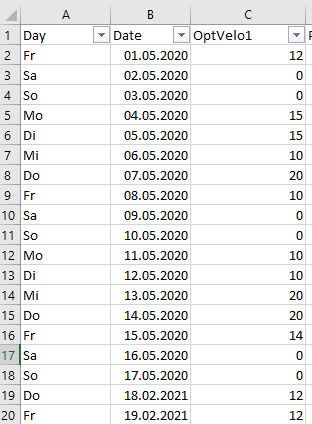
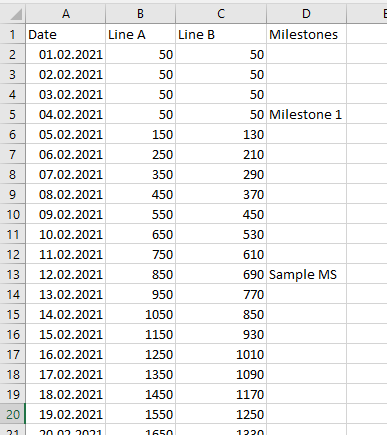
The excel looks like this:
First columns holds the date of each day (also visible in the version report).
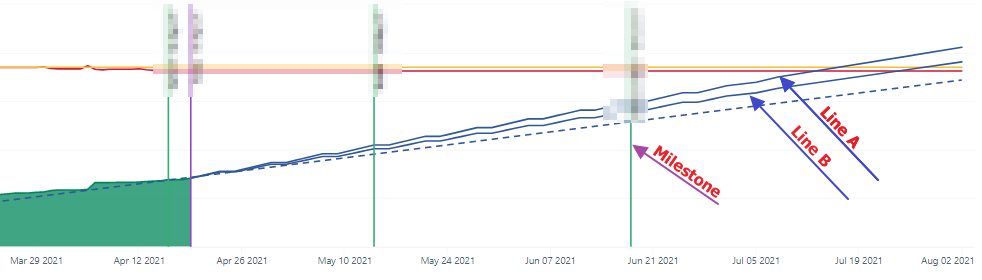
2nd and 3rd column shows the number of Storypoint prediction (optimistic, pessimistic), which I want to use to draw a line A and a line B
4th column I would like to use to draw vertical lines (milestones) in the BurnUp graph showing the text as a lable.
How to I need to import this excel file as additional source file into eazyBI, so that I can use this data as additional measure or dimension in the version report?
@Christian1
If there will be just one excel for each eazyBI account and there is just one sprint in account you are reporting about, your file can stay as it is and you could map the data to “Time” dimension when importing additional measures from the excel file.
Then you could create a calculated measure that returns the “values” from imported file using the “Sprint” defaultmember.
But I would recommend using also a “Sprint” column in your file and then map this column to “Sprint” dimension members to associate new imported measures with a particular sprint - the same sprint you are selecting in the report.
Hello @martins.vanags , many thanks for your answer. Not sure if I understood correctly. In the version report (example for your demo account) I don’t select any Sprint. I would like to see a Version BurnUp from start of project till end (having multiple sprints). Not sure if your recommendation to use Sprint default member will work in my case.
I use only the Time dimension in the Version report
@Christian1
two new imported measures has no information about filters you select in the page filter for your report, that is why they are empty.
You can’t filter these two measures by “Labbel” or “Fix Version” because eazyBI does not know how to split new measures Line A and Line B for these dimensions.
Either you create a measure using defaultContext (and ignore Label and Fix Version filter) or you find a way to import more granular data.
You can try creating a new calculated measure using default context:
This one for Line A
That would be a challenge because you can’t import properties for “Time” dimension members.
But string type values can’t be imported as measures from the Excel files.
They can be either as properties for some existing dimension or new dimensions (but that is not needed in your case and eazyBI won’t let you create new dimension in the “Issues” cube from additional file).
Not so much options for this use-case without adding extra layer in the excel file.
Hello @martins.vanags,
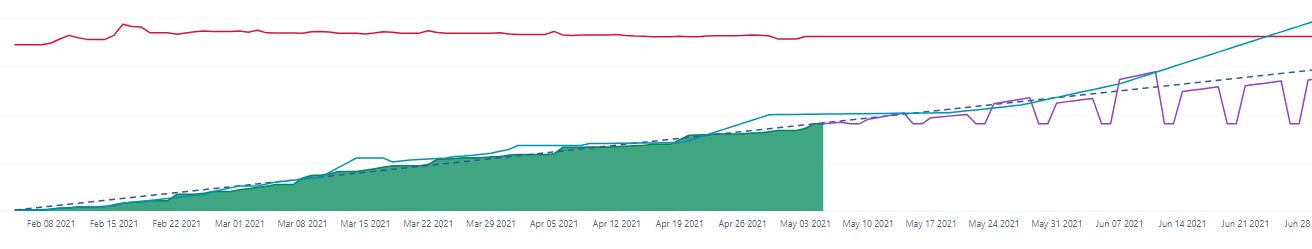
sorry I have another request quite similar to previous one. With the answer you provided me first I am now able to draw lines from starting point of graph (version start) (see blue line in example). In the excel I put total number of SP predicted per day.
Next I need to draw forecast starting from today with the already achieved storypoints and a given velocity (purple line) (which also change quite often, so it shall also be inside an excel)
I put similar excel file
I do use the same settings to import the excel and also add the default context.
Then I put a measure like
--annotations.group=Predicted
Case
when
  DateInPeriod(
    'Today',[Time].CurrentHierarchyMember)
then
   NonZero((
    [Measures].[Story Points resolved],
    [Time].CurrentHierarchy.DefaultMember))
When
 DateBetween(
    [Time].CurrentHierarchymember.StartDate,
    'Today', [Measures].[Predicted completion date])

  Then
  -- current progress
    NonZero((
    [Measures].[Story Points resolved],
    [Time].CurrentHierarchy.DefaultMember))
    +
    -- add pace for each day in future taken from the excel
    [Measures].[Velocity2 - default context - debug]


    *
    DateDiffWorkDays('Tomorrow',[Time].CurrentHierarchyMember.NextStartDate)
End

 .
.