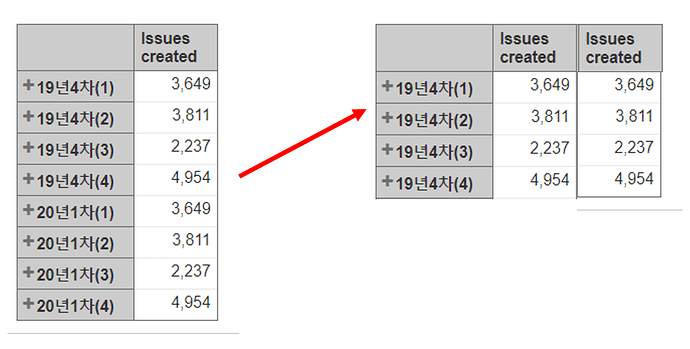
hi I would like to make a graph like a picture below.
I want to to know about how to make a row parrellel.
rows dimension is ‘time’ dimension.
time dimension which i defined is below.
19년4차(1) = Aggregate(
[Time].[Day].DateMembersBetween(‘2019-11-22’,‘2019-12-07’)
)
19년4차(2) = Aggregate(
[Time].[Day].DateMembersBetween(‘2019-12-07’,‘2019-12-22’)
)
Hi,
There is a standard function to have the data of parallel periods. You can check this function here in the documentation: https://docs.eazybi.com/eazybi/analyze-and-visualize/calculated-measures-and-members/mdx-function-reference/parallelperiod.
This function, however, has a limitation that it works only on the members of the standard hierarchy of Time dimension. That will not cover your case, unfortunately.
The solution for your case would be to hardcode the parallel periods in the calculation with a case statement like this:
CASE [Time].CurrentHierarchyMember.Name
WHEN
"My custom time member" THEN
NonZero((
  [Measures].[Issues created],
  [Time].[My custom time member parallel]
))
WHEN --etc
THEN
END
Kindly,
Janis, eazyBI support
