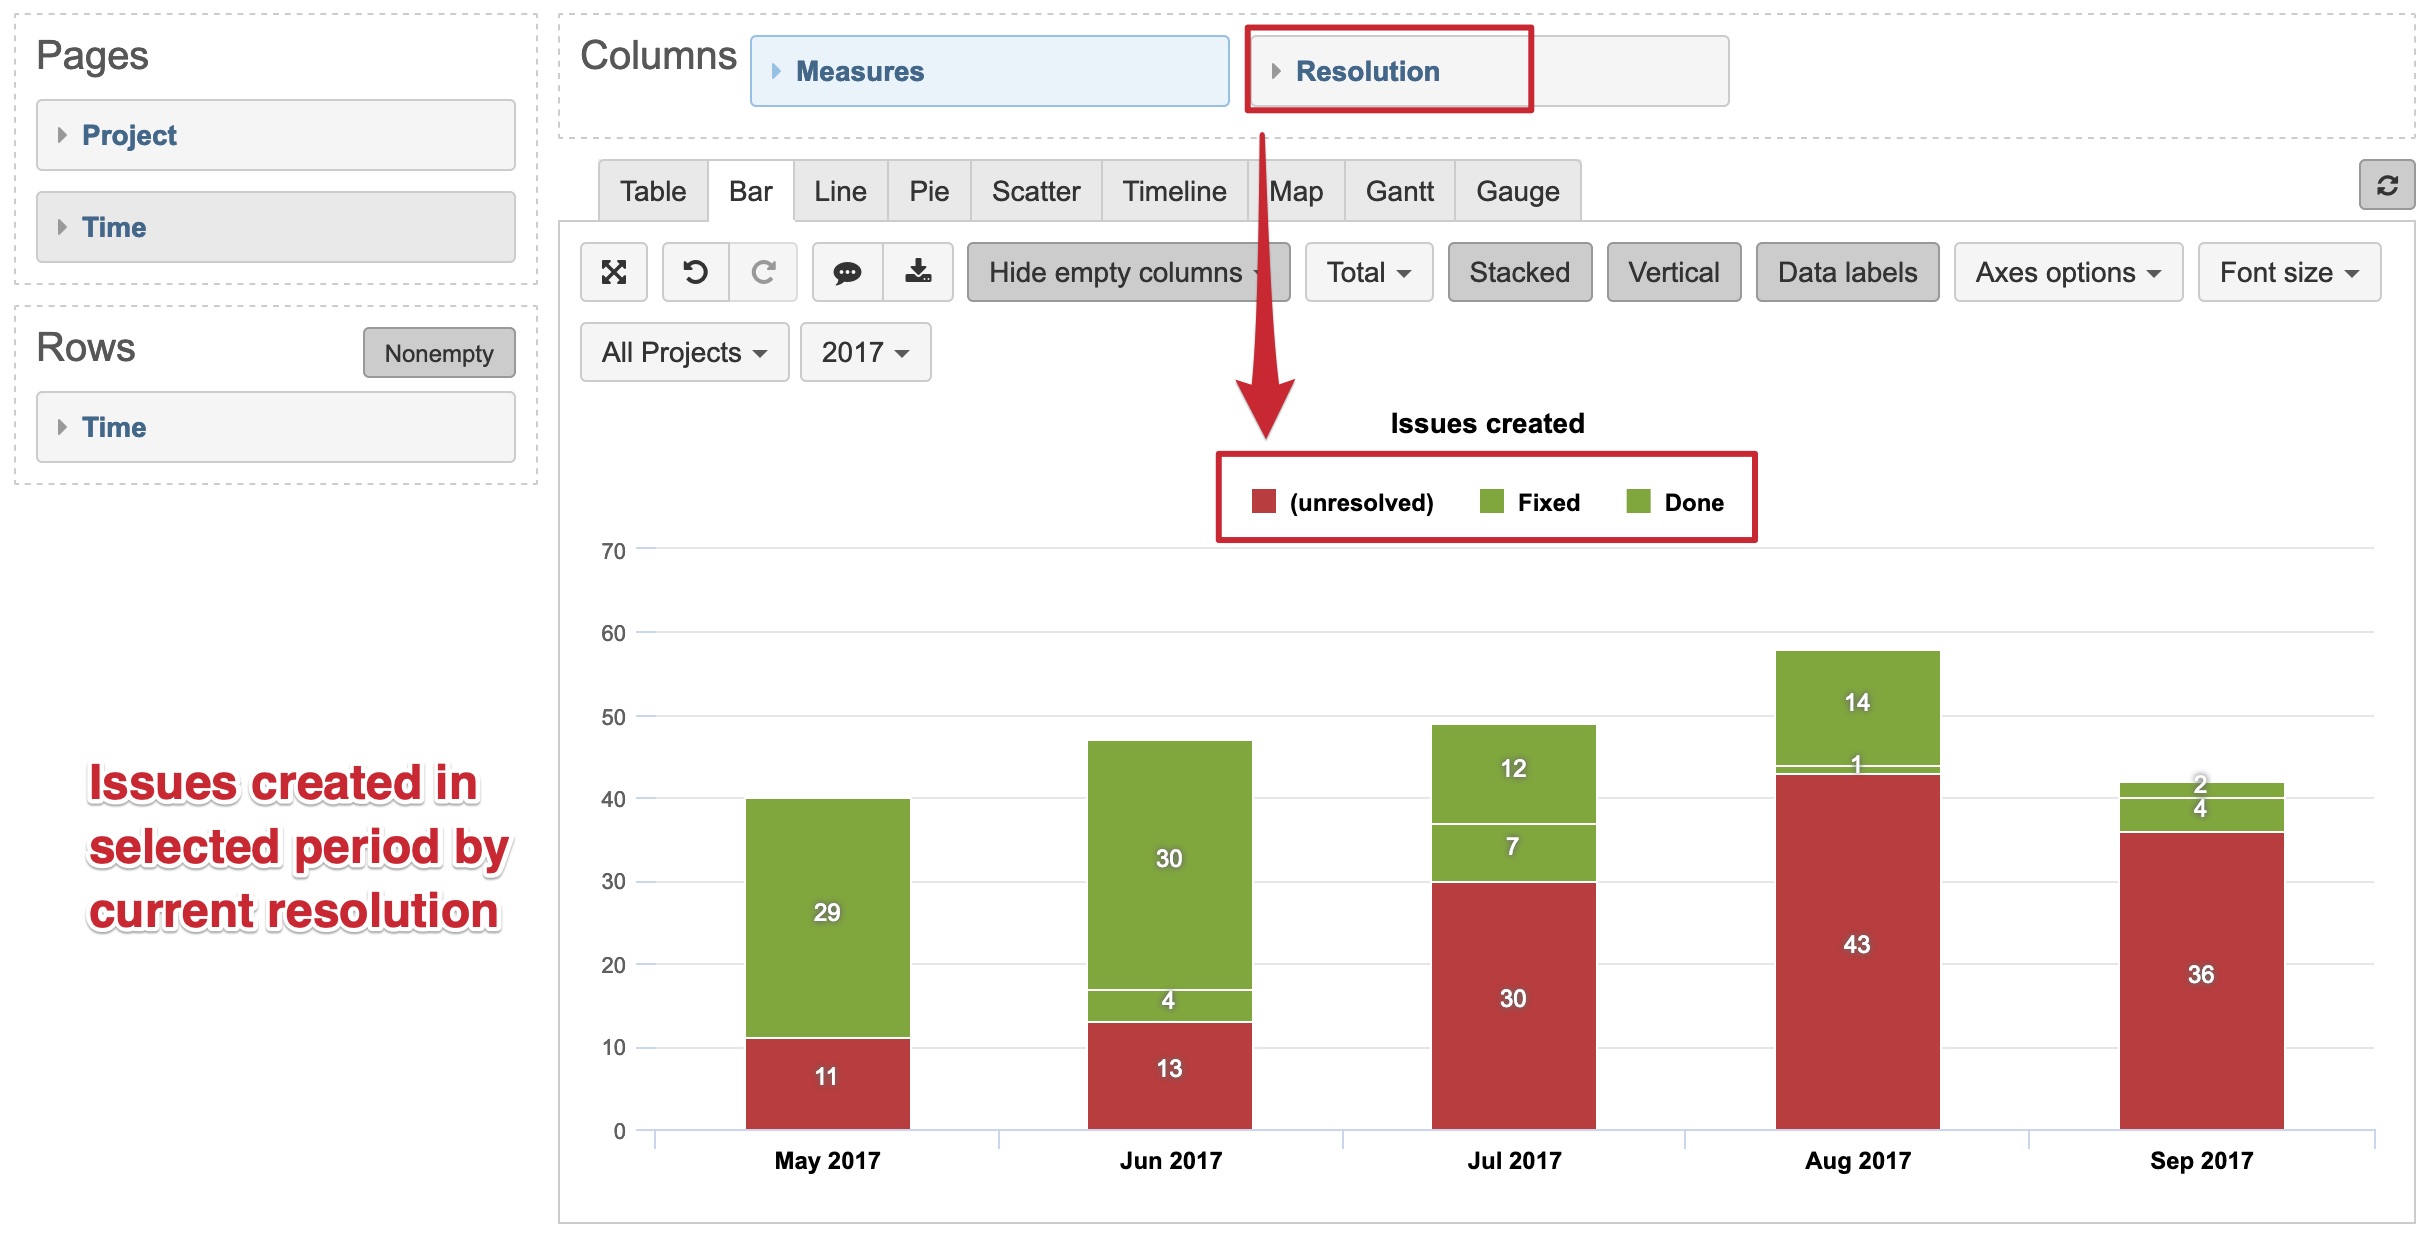
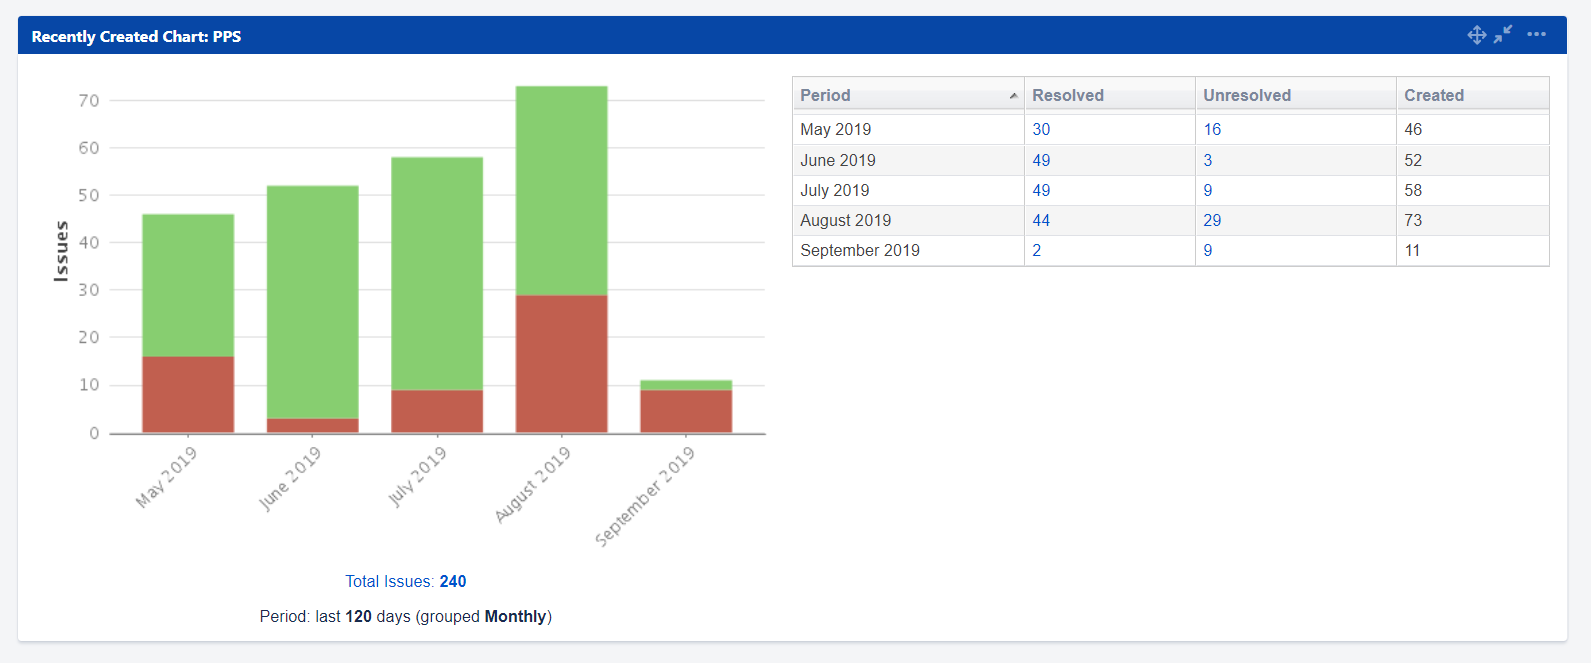
I need help figuring out how to make a very specific calculated member; It’s beyond my MDX ability. My end goal is to have a bar chart with a bar for each week in the past 5 weeks. The metrics that the bars display is what I can’t figure out. I need each weekly bar to tell me how many of the issues that were created in that week, are still open currently. This is sort of what the Recently Created Chart does, which is a built-in widget in Jira. If you are familiar with this chart and what it does, I basically want to recreate the red part of each bar. Example:
I’m not sure if you can isolate the issues that were created in a past week, and then see their status as it currently is. To clarify, I’m not trying to figure out how many issues were created and resolved within that week. I’m trying to look at all the issues that are still open to date, broken down into the week that they were originally created. Please let me know if this is possible, and any ideas you have about how to create this calculated member!