Hello guys,
I’m a newbie and unfortunately, I got a requirement from user to make these kinds of report :
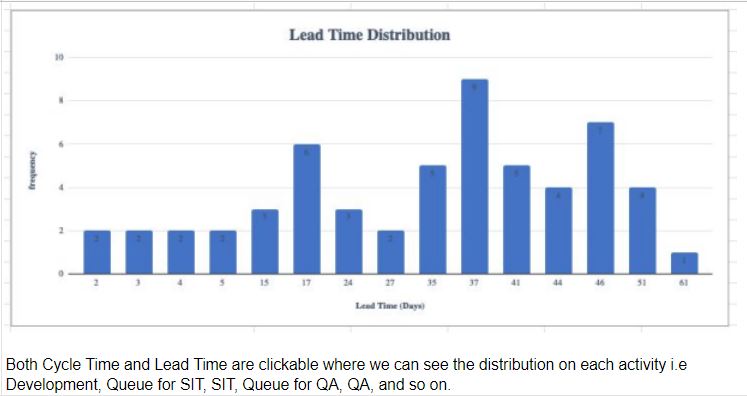
Lead Time Distribution :
X axis: days elapsed from open to closed
Y axis: No of ticket
Filter all closed “development” issues (closed in the past 90 days)
and
Cycle Time Distribution
X axis: days elapsed from in Progress to closed
Y axis: No of ticket
Filter all closed “development” issues (closed in the past 90 days)
I’ve tried to make the reports, but the results are still wrong 
Thanks for your help~
Regards,
Sindy
Hi @sinchan_3188
Welcome to the community!
You may want to start with Resolution dimension which shows the issue distribution by resolution time (from creation date to resolution date).
If this is not what you were looking for, you may use JavaScript calculated custom field to calculate lead time for each issue during data import. This field would contain a calculated number of days (lead time) between two dates (transition to In Progress and closing date) and would be imported with setting that allows to import this number as a interval dimension.
Here is described a couple of examples how to do that (including needed advanced settings): https://docs.eazybi.com/eazybijira/data-import/custom-fields/javascript-calculated-custom-fields#JavaScriptcalculatedcustomfields-Customcalculatedfieldasanintervaldimension
After importing this interval dimension, in the report, you would use this interval dimension with a measure “Issues created”. Then issues would be counted to the correct interval accordingly to the calculated lead time.
Best,
Ilze / support@eazybi.com