Hello,
As shown in the picture, I want to make a report of the SQL result as it is.
The SQL result has only column data not rows.
How can I make the sql result as table on analyze tab?
Thank you.
Thank you.
Hello,
As shown in the picture, I want to make a report of the SQL result as it is.
The SQL result has only column data not rows.
How can I make the sql result as table on analyze tab?
Thank you.
Thank you.
Hi,
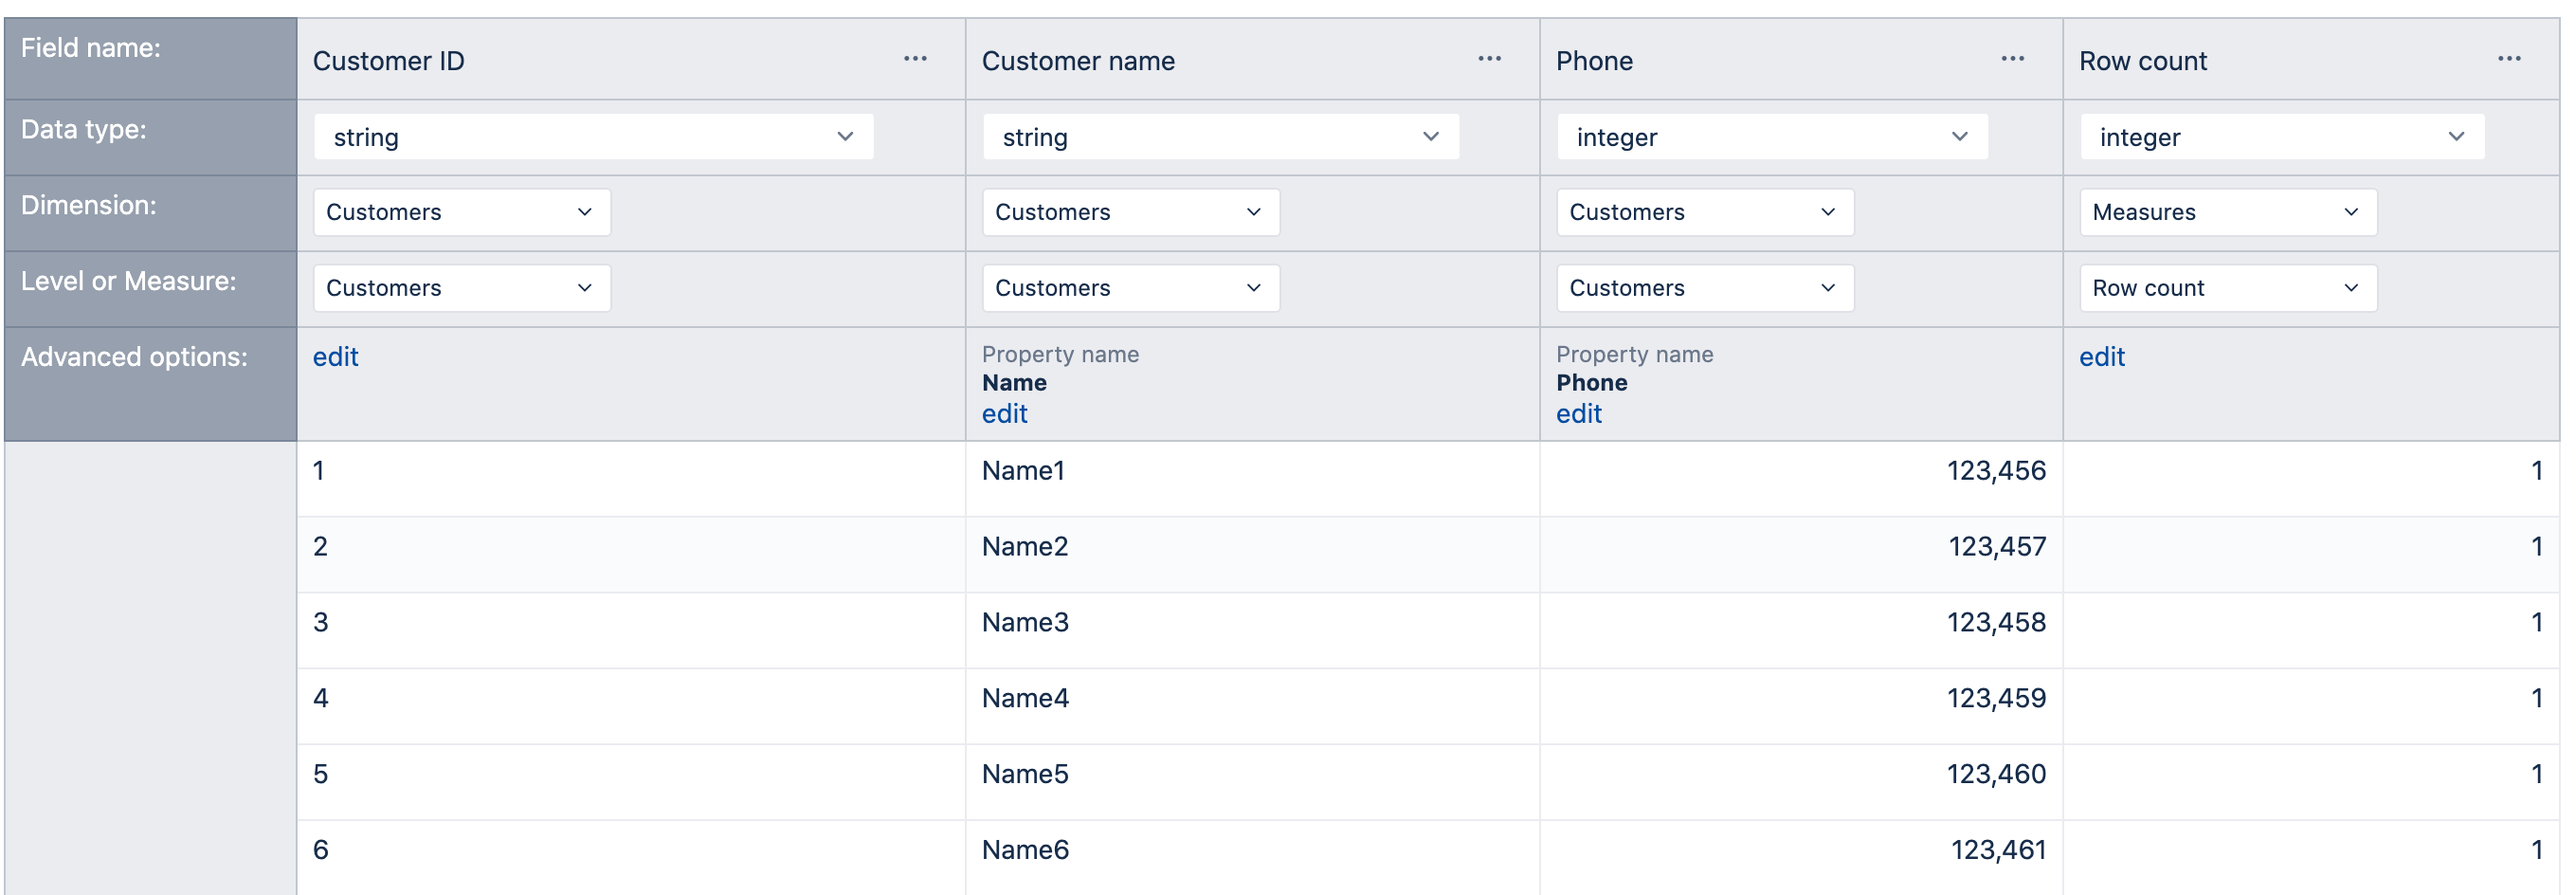
The closest solution to show the list of records in eazyBI is to use the ID column as a dimension. All the string members should be the properties, and the numerics should be mapped as measures. If you do not have any measure in your columns, you should generate the “Counter” column (giving “1”) for the row count since data mapping requires at least one measure.
The mapping could look like that:
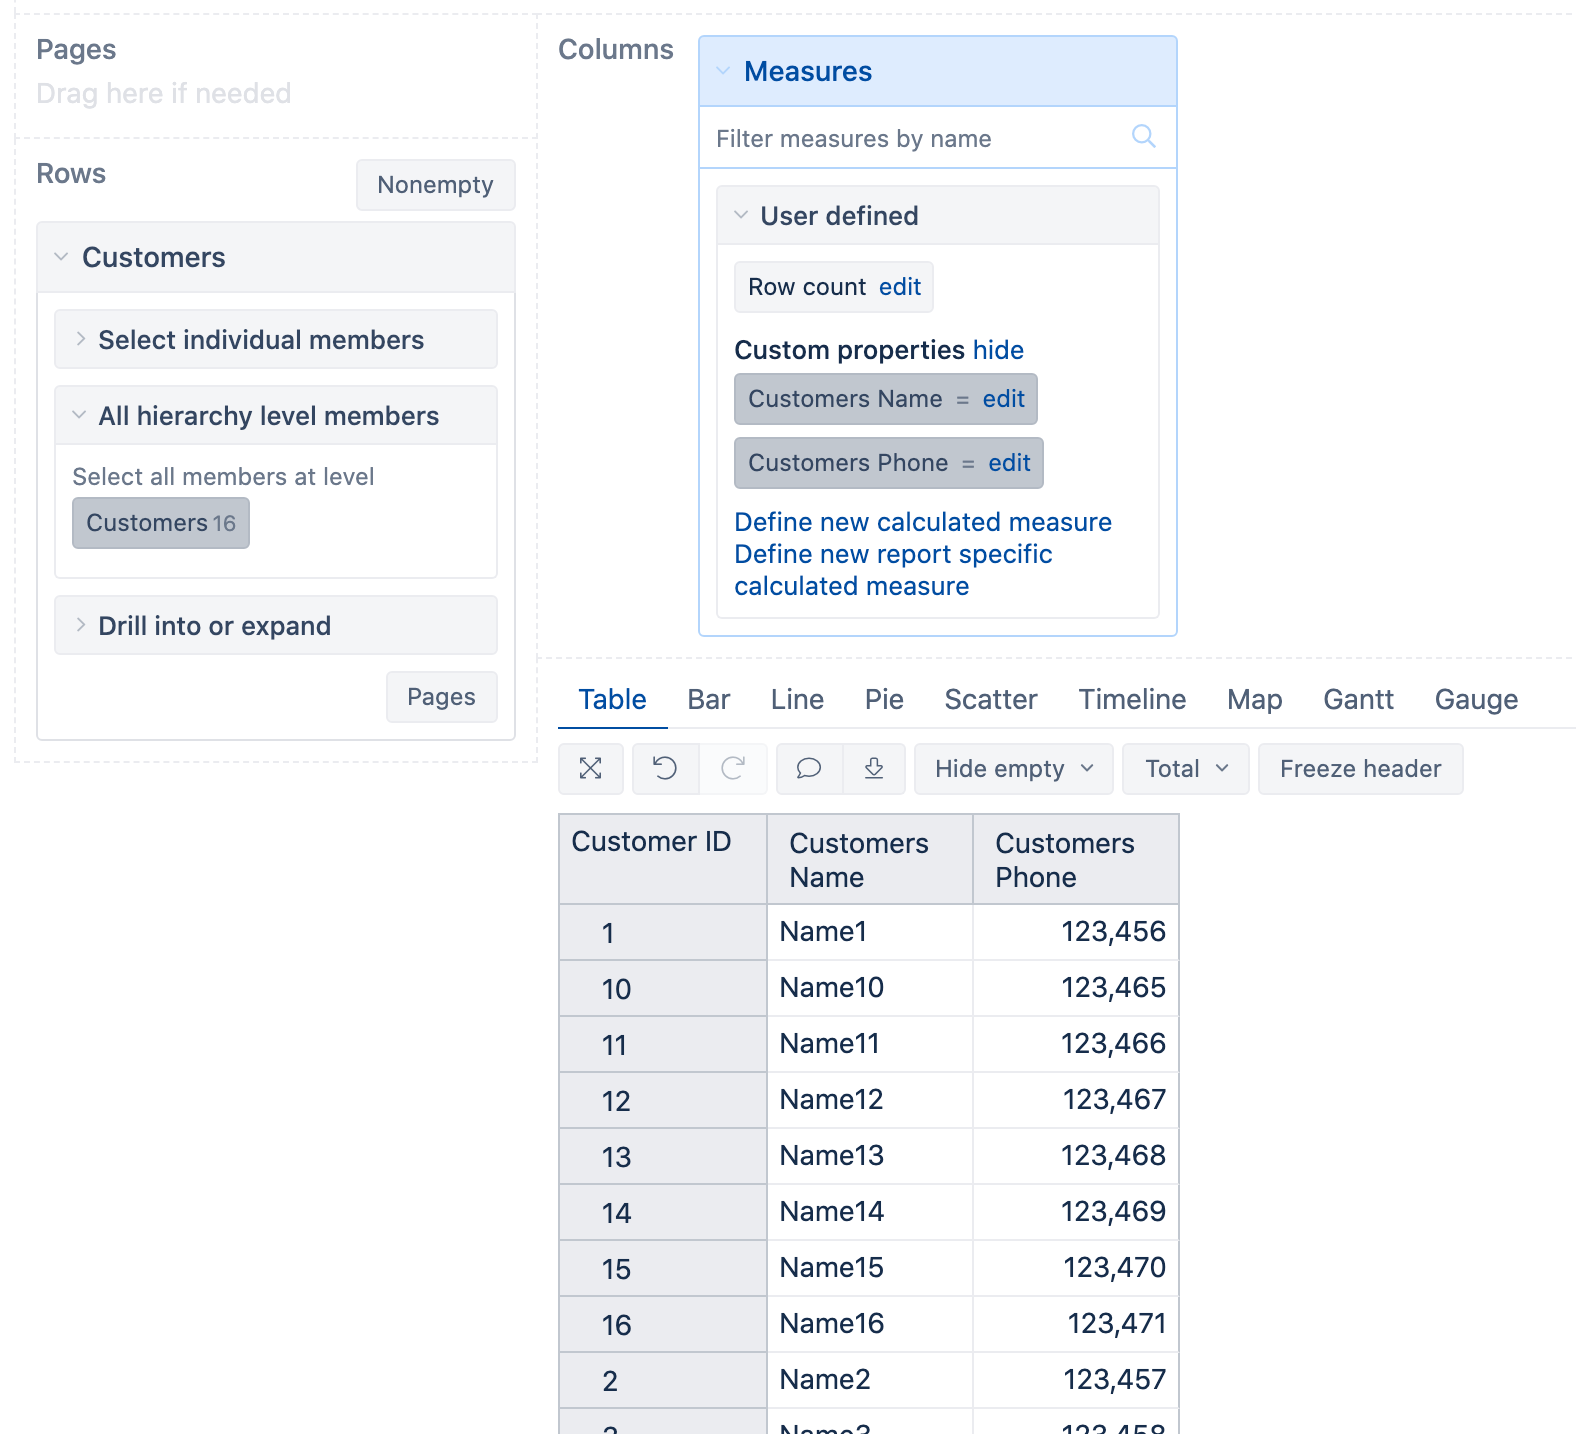
The report:
Kindly,
Janis, eazyBI support