Hello, I would like to draw a manual line with estimated velocity inside the standard Version report. I use a measure, which works quite ok in case the velocity stays same all time (for example 200points per Sprint). I would like to change the expected velocity in the graph (vacation, different team size,…). I changed the measure in a way, but unfortunately the line “jumps” from one section to the other.
What am I do wrong here?
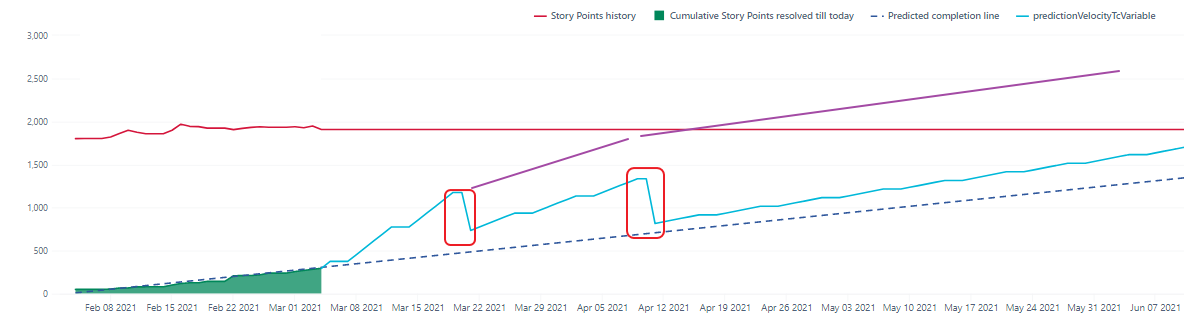
Example 200SP/sprint by default. In March 800SP/Sprint and in April 400SP per sprint.
This is my measure:
Case
when
  DateInPeriod(
    'Today',[Time].CurrentHierarchyMember)
then
   NonZero((
    [Measures].[Story Points resolved],
    [Time].CurrentHierarchy.DefaultMember))
When
 DateBetween(
    [Time].CurrentHierarchymember.StartDate,
    'Today', [Measures].[Predicted completion date])

  Then
  -- current progress
    NonZero((
    [Measures].[Story Points resolved],
    [Time].CurrentHierarchy.DefaultMember))
   +
      Case
      When DateBetween([Time].CurrentHierarchyMember.StartDate,'2021-03-01', '2021-03-20')
      Then
       800/10
      WHEN DateBetween([Time].CurrentHierarchyMember.StartDate,'2021-03-20', '2021-04-10')
       THEN
       400/10
      ELSE
       200/10
      End

    *
    DateDiffWorkDays('Tomorrow',[Time].CurrentHierarchyMember.NextStartDate)
End
My graph looks like this: (cyan line)
I would expect to see s.th. like the purple lines. Why does my cyan measure jumps down at the end of the month?
Many thanks
Christian
Hi @Christian1 ,
In your formula, current progress should accumulate results from previous periods so there is no drop in your predicted velocity.
That formula should look like this:
CASE
  WHEN
    DateInPeriod('Today',[Time].CurrentHierarchyMember)
  THEN
     NonZero(([Measures].[Story Points resolved],[Time].CurrentHierarchy.DefaultMember))
  WHEN
   DateBetween([Time].CurrentHierarchymember.StartDate,'Today', [Measures].[Predicted completion date])
  THEN
  ([Measures].[Story Points resolved],[Time].CurrentHierarchy.DefaultMember)
  +
    CASE
      WHEN DateBetween([Time].CurrentHierarchyMember.StartDate,'2021-03-01', '2021-03-20')
      THEN
        ([Measures].[Story Points resolved],[Time].[2021].[Q1 2021].[Mar 2021].[Mar 20 2021])
        + 800/10
        * DateDiffWorkDays('Tomorrow',[Time].CurrentHierarchyMember.NextStartDate)
      WHEN DateBetween([Time].CurrentHierarchyMember.StartDate,'2021-03-20', '2021-04-10')
      THEN
        -- previous + new
        ([Measures].[Story Points resolved],[Time].[2021].[Q1 2021].[Mar 2021].[Mar 20 2021])
        + 800/10
        * DateDiffWorkDays('Tomorrow',[Time].CurrentHierarchyMember.NextStartDate)
        + ([Measures].[Story Points resolved],[Time].[2021].[Q2 2021].[Apr 2021].[Apr 10 2021])
        + 400/10
        * DateDiffWorkDays('Tomorrow',[Time].CurrentHierarchyMember.NextStartDate)
    ELSE
      -- + both previous + new
      ([Measures].[Story Points resolved],[Time].[2021].[Q1 2021].[Mar 2021].[Mar 20 2021])
      + 800/10
      * DateDiffWorkDays('Tomorrow',[Time].CurrentHierarchyMember.NextStartDate)
      + ([Measures].[Story Points resolved],[Time].[2021].[Q2 2021].[Apr 2021].[Apr 10 2021])
      + 400/10
      * DateDiffWorkDays('Tomorrow',[Time].CurrentHierarchyMember.NextStartDate)
      + 200/10
      * DateDiffWorkDays('Tomorrow',[Time].CurrentHierarchyMember.NextStartDate)
    END
END
best,
Gerda // support@eazyBI.com