Hi I am new to EazyBI and want one report that will reflect the Average Resolution Time for both the P1-Stopper Priority and P2-High Priority.
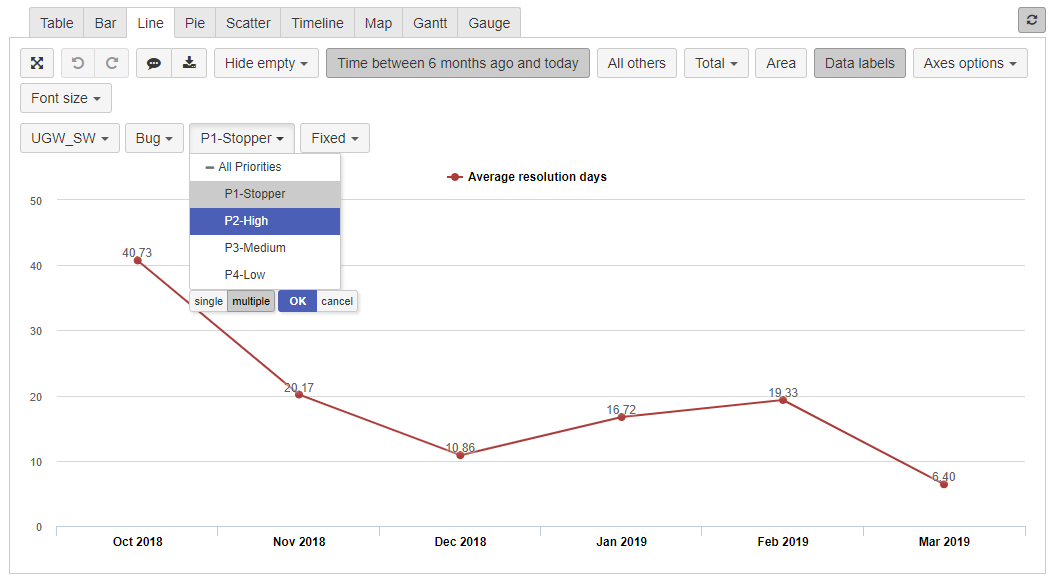
In the image below I am getting both the P1 and P2 Priority issues being reflected using the same line. I want this to be seperated. Like one Plot for P1 and one Plot for P2. Is there a way I can achieve that in the same report?
Hello Arunava,
Yes , you can achieve it by placing the PRIORITY dimension into columns as well as in pages.
Below are the steps,
- Place Priority Dimension in columns.
- Select “Pages” option.
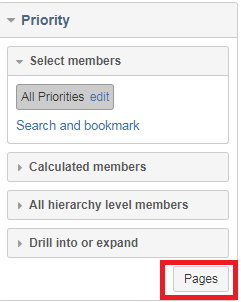
2.2 : select Priority level . - Now you can see the PRIORITY in separate line.
- also you can filter which are the priority from filter section.
more over, you can use mdx for average resolution days like below to replace empty value to 0.
CASE
WHEN
IsEmpty([Measures].[Average resolution workdays])
THEN
0
ELSE
[Measures].[Average resolution workdays]
END
please let me know if you have any questions,
1 Like
Thanks Ganesh. It worked like a wonder. 
I was trying mostly with MDX queries but this solution seems much easier.
It has solved the issue. Thank You so much.
Great to hear that your problem got resolved.
You are welcome.