Hi Team,
I am new to EazyBI add-on.
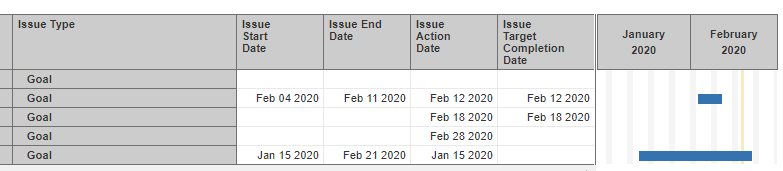
We have created a Grantt chart for an issue type called GOAL from a four different Date field values to track the milestones. Now we want to plot the issues that Action Date and Completion Date on Same day in length.
Thanks in advance,
Manikanta
Hi,
The solution is to apply the filter on the report rows to show only those issue having the both dates in the same day. That would require a custom measure and there can be several alternatives of how to implement it.
I tried the following formula for checking if two dates are in the same day:
Day(DateParse([Measures].[Issue Action Date]))
= Day (DateParse([Measures].[Issue Target Completion Date]))
AND
DateDiffDays([Measures].[Issue Action Date],
[Measures].[Issue Target Completion Date])<1
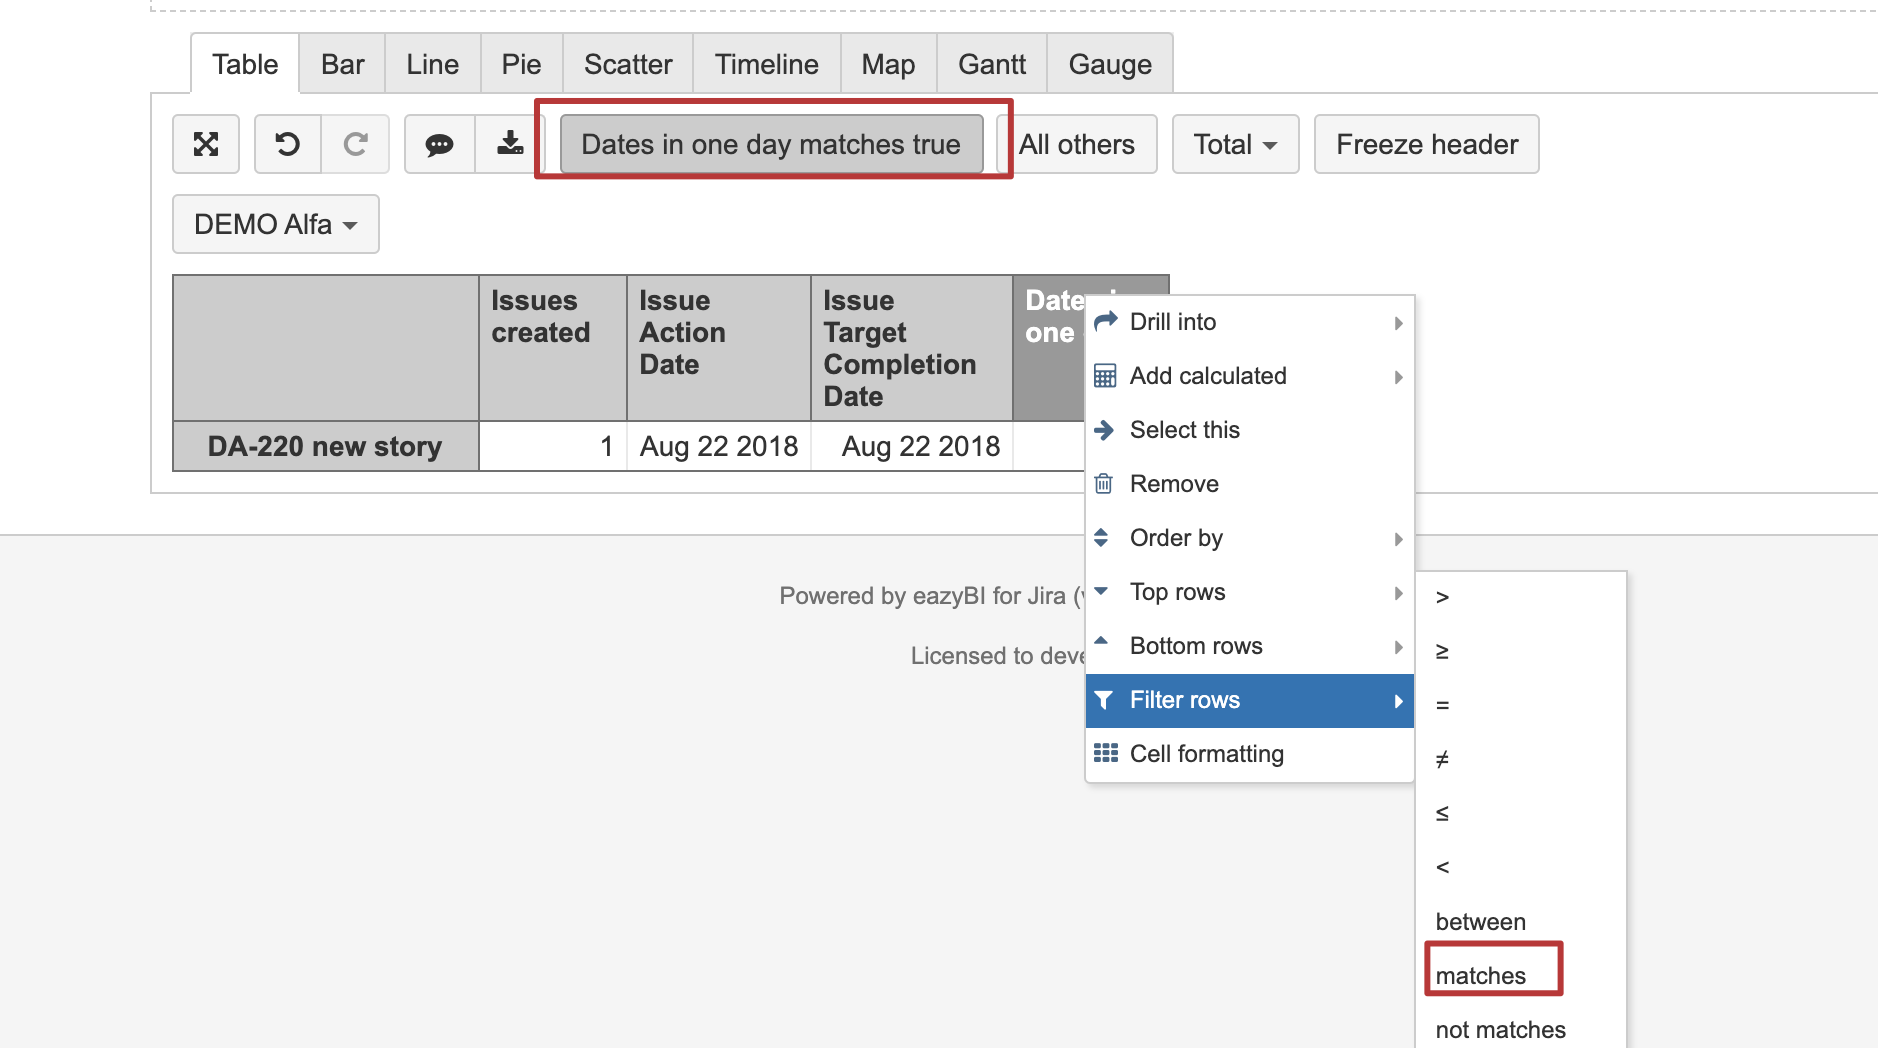
With such a custom measure you can apply the filtering in the report rows:
Kindly,
Janis, eazyBI support