How to reproduce Jira Control Chart “Average Cycle Time” in eazyBI

Hi everyone,

Imagine you manage several Jira projects. Instead of opening the Control Chart in each project one by one to check their Average Cycle Time, I’d like to have a single eazyBI report that shows these values side by side — directly in eazyBI, using the same calculation logic as Jira’s Control Chart.

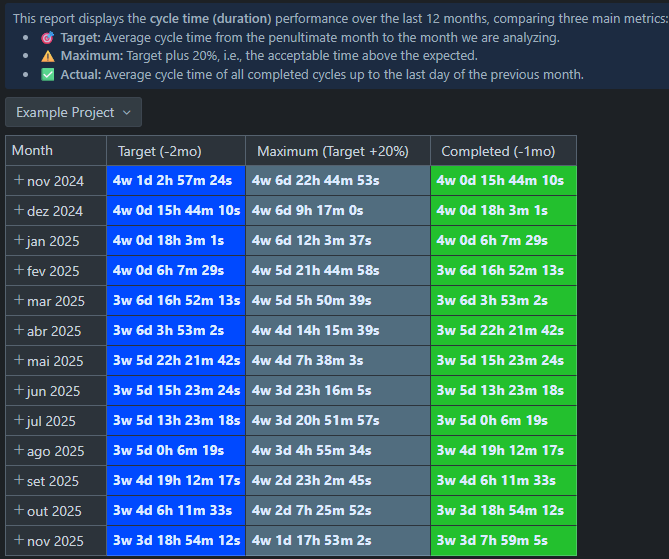
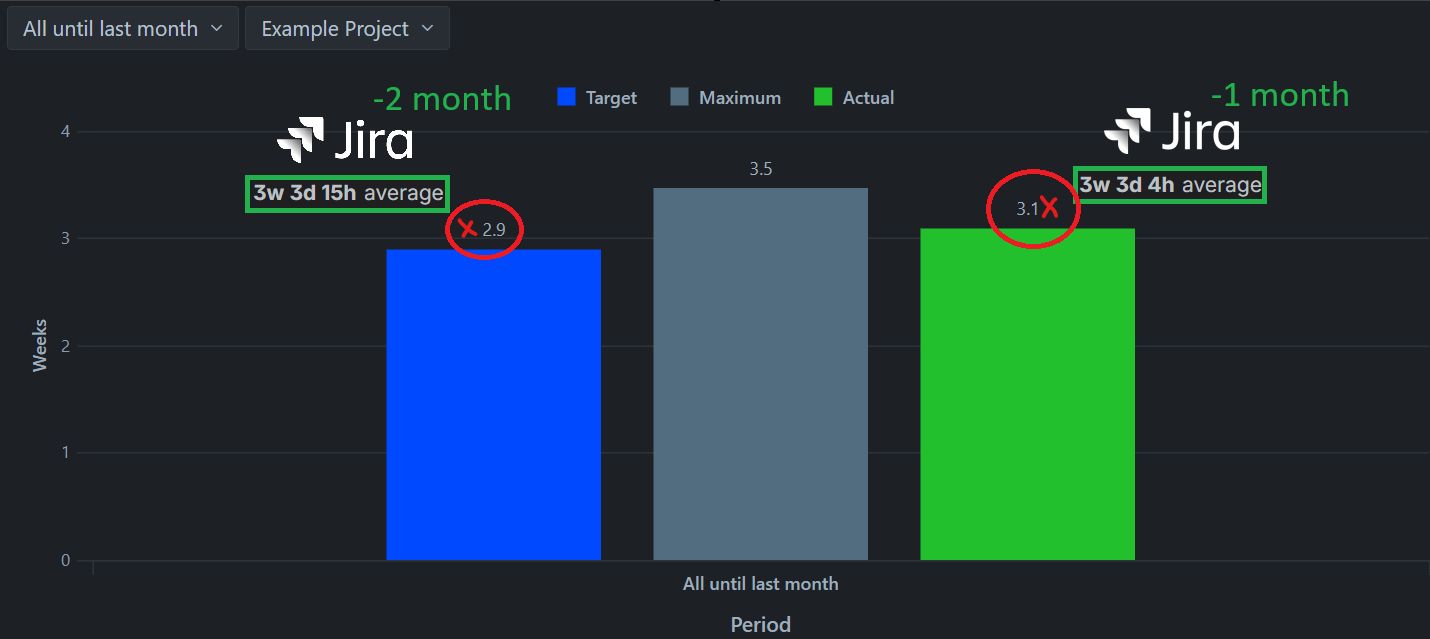
I’ve already built a report called “Cycle Time (Duration)”, and it’s almost matching the Control Chart results, but not exactly. It seems there’s a small difference in how the average or time window is being calculated.

What I’m trying to achieve:

  • Actual (-1mo): Average Cycle Time for the previous month
  • Target (-2mo): Average Cycle Time for two months ago

These measures should always adjust automatically — for example, when we move into a new month, the time window shifts back accordingly.

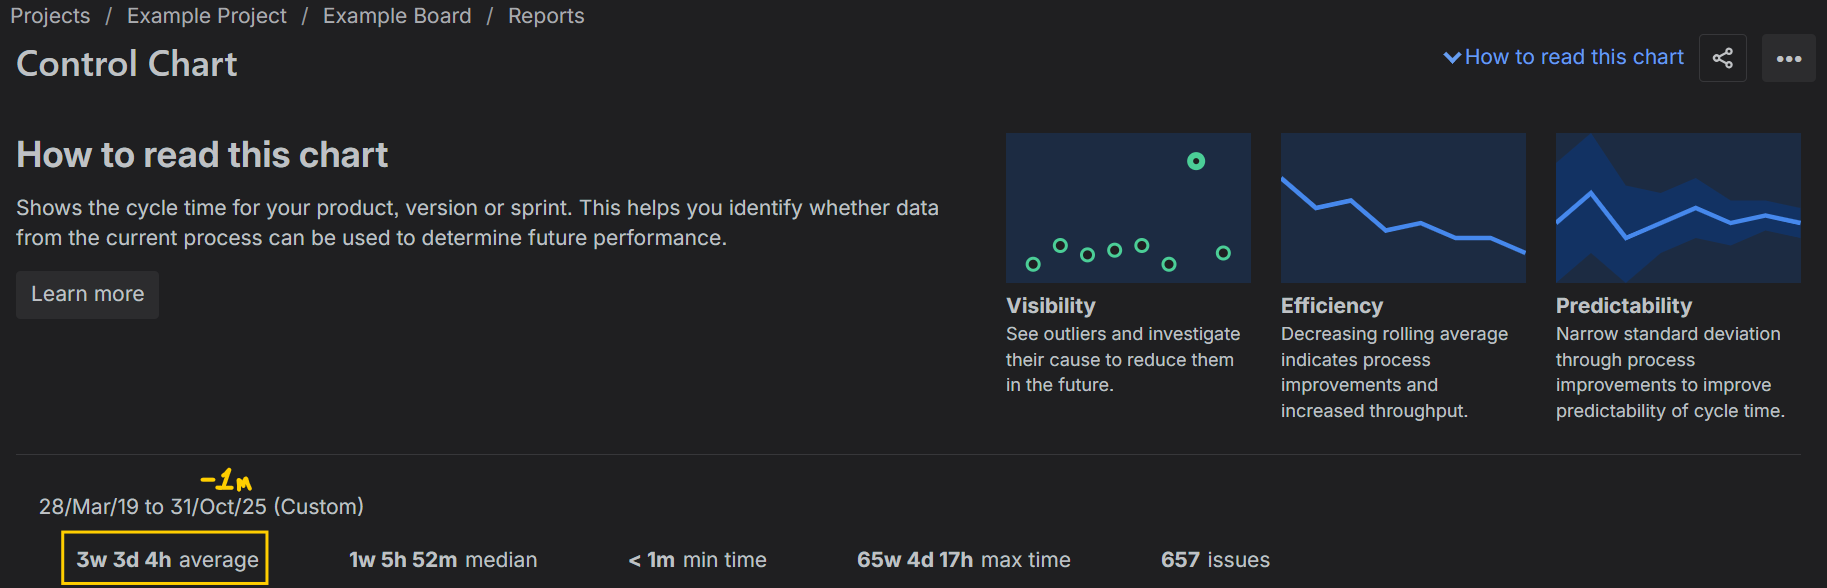
Example (today = Nov 11, 2025) in Jira’s Control Chart:

  • Actual: 28/Mar/19 → 31/Oct/25 (Timeframe) → 3w 3d 4h Average Cycle Time (-1mo)
  • Target: 28/Mar/19 → 30/Sep/25 (Timeframe) → 3w 3d 15h Average Cycle Time (-2mo)

These are the expected results when using the same project and status filters.
However, in eazyBI, the numbers are close but not identical — even when using the same filters and measuring Cycle Time based on the In Progress status category.

Current MDX formulas:

  • Target (-2mo):
CASE 
  WHEN NOT IsEmpty([Measures].[Issues resolved count]) AND 
       [Measures].[Issues resolved count] > 0 
  THEN
    ROUND(
      (
        Sum(
          -- Filter time to include only periods up to the previous closed month
          Filter(
            Descendants([Time].[Month].Members, [Time].[Month]),
            [Time].CurrentMember < [Time].CurrentHierarchyMember.PrevMember
          ),
          -- Consider only time in statuses from the "In Progress" category
          ([Measures].[Days in transition status],
           [Transition Status.Category].[In Progress])
        ) * 1.0 /
        Sum(
          Filter(
            Descendants([Time].[Month].Members, [Time].[Month]),
            [Time].CurrentMember < [Time].CurrentHierarchyMember.PrevMember
          ),
          [Measures].[Issues resolved count]
        )
      ) / 7,
      2
    )
  ELSE
    NULL
END
  • Maximum (Target * 1.2):
CoalesceEmpty([Measures].[Target], 0) * 1.2
  • Actual (-1mo):
CASE
  WHEN 
    NOT IsEmpty([Measures].[Issues resolved count]) AND
    [Measures].[Issues resolved count] > 0
  THEN
    ROUND(
      (
        Sum(
          Filter(
            DescendantsSet([Issue].CurrentHierarchyMember, [Issue].[Issue]),
            -- Filter only issues with "Done" status, excluding "Cancelado"
            [Measures].[Issue status] <> 'Cancelado'
            AND
            ([Measures].[Issues resolved], [Status.Category].[Done]) > 0
          ),
          (
            [Measures].[Days in transition status],
            [Transition Status.Category].[In Progress]
          )
        ) / 7 + 0.142857 -- Add minimum equivalent of 1 day in weeks
      ) / 
      Sum(
        Filter(
          DescendantsSet([Issue].CurrentHierarchyMember, [Issue].[Issue]),
          -- Same filter for denominator
          [Measures].[Issue status] <> 'Cancelado'
          AND
          ([Measures].[Issues resolved], [Status.Category].[Done]) > 0
        ),
        [Measures].[Issues resolved]
      ),
      2
    )
  ELSE
    NULL
END

Goal: Create a dynamic eazyBI report (by Project) that displays the exact same Average Cycle Time value shown in the Jira Control Chart, comparing the previous month (-1mo) and two months ago (-2mo).

Questions:

  1. Has anyone managed to get exactly the same Average Cycle Time values from Jira’s Control Chart inside eazyBI?
  2. Is there a more accurate MDX approach or recommended setup to make both calculations match precisely?

Thanks in advance for your help!

Best Regards,

Hi @emersonsoaresdasilva
Thank you for posting your question!
I would like to start with pointing out that eazyBI cannot guarantee exact matching with Jira’s native Control Chart because the internal calculation logic and filtering mechanisms used by Jira’s Control Chart are not publicly documented. Even when using the same filters and time periods, there may be subtle differences in how Jira processes the data versus how eazyBI calculates it, especially when it comes to how calculations are handled when an issue moves between statuses multiple times.

That said, here’s the recommended approach for calculating cycle time in eazyBI:
Use the Issue Cycles feature instead of trying to replicate Jira’s exact calculation. This is eazyBI’s native way to track cycle time and provides reliable, well-documented measures.
You can find more about how to impor the issue cycles here - Issue cycles

Let’s assume you want to import the “In Progress” cycle.

  1. In your eazyBI data source settings, enable the “In Progress” cycle under the Issue Cycles section

  2. After the next data import, eazyBI will automatically create several measures, including:

    • Progress days of resolved issues - total cycle time in the period

    • Average Progress days - average days issues spent in the “In Progress” cycle

    • Issues resolved - count of resolved issues

  3. To calculate the average cycle time for a specific period, use:

[Measures].[Progress days of resolved issues]
/
[Measures].[Issues resolved]

For your dynamic time windows (-1mo and -2mo):
You can create calculated members with the Tuple function that filter by specific time periods using the selected Time dimension. For example, for the previous month:

([Measures].[Progress days of resolved issues], [Time].CurrentHierarchyMember.PrevMember)
/
([Measures].[Issues resolved], 
[Time].CurrentHierarchyMember.PrevMember)

Here are some reasons why the data between Jira and eazyBI might differ:

  1. Jira’s Control Chart may use different date boundaries or include/exclude certain dates differently

  2. There might be subtle differences in which issues are included (e.g., how issues that moved in/out of statuses multiple times are handled)

  3. Different rounding approaches can cause small variations

  4. Ensure your Transition Status categories in eazyBI match exactly with Jira’s status categories

To be able to explain the differences, I would need to see some specific examples considering only a few issue set so that it is easier to compare the timestamps when issues movied in/out of the statuses.

Here’s an example of our demo report on the progress cycle control chart
https://eazybi.com/accounts/1000/cubes/Issues/reports/1071697-control-chart-progress-cycle

Let me know if you have any follow-up questions regarding this or if you would like me to check the results on your data to explain where the differences may be coming from.

Best regards,

Elita from support@eazybi.com

1 Like

Hi @Elita.Kalane, thank you so much for continuous support.

I’d like to share the results I’ve reached after some experimentation work over the past weeks. Overall, I was able to get very close to the expected outcomes, and the accuracy of the data looks solid based on the validations I performed.

Average seconds (up to the previous month)
CoalesceEmpty(
  IIF(
    DateCompare([Time].CurrentHierarchyMember.StartDate, Now()) <= 0,
    Avg(
      Filter(
        Descendants([Issue].CurrentHierarchyMember, [Issue].[Issue]),
        NOT IsEmpty(([Measures].[Issue resolution date], [Time].[All Times]))
        AND DateCompare(
          ([Measures].[Issue resolution date], [Time].[All Times]),
          DateAdd('s', -1, [Time].CurrentHierarchyMember.StartDate)
        ) <= 0
        AND (
          [Measures].[Days in transition status],
          [Transition Status.Category].[In Progress],
          [Time].[All Times]
        ) > 0
      ),
      (
        [Measures].[Days in transition status],
        [Transition Status.Category].[In Progress],
        [Time].[All Times]
      ) * 86400
    ),
    NULL
  ),
  0
)
Average seconds (up to the second-to-last month)
CoalesceEmpty(
  IIF(
    DateCompare([Time].CurrentHierarchyMember.StartDate, Now()) <= 0,
    Avg(
      Filter(
        Descendants([Issue].CurrentHierarchyMember, [Issue].[Issue]),
        NOT IsEmpty(([Measures].[Issue resolution date], [Time].[All Times]))
        AND DateCompare(
          ([Measures].[Issue resolution date], [Time].[All Times]),
          DateAdd('s', -1, [Time].CurrentHierarchyMember.PrevMember.StartDate)
        ) <= 0
        AND (
          [Measures].[Days in transition status],
          [Transition Status.Category].[In Progress],
          [Time].[All Times]
        ) > 0
      ),
      (
        [Measures].[Days in transition status],
        [Transition Status.Category].[In Progress],
        [Time].[All Times]
      ) * 86400
    ),
    NULL
  ),
  0
)
Average seconds (up to maximum)
CASE 
WHEN [Measures].[Average seconds (up to the second-to-last month)] > 0
THEN
  [Measures].[Average seconds (up to the second-to-last month)] * 1.2
ELSE
  NULL
END

With these measures, I managed to build the report below, which seems to meet what we were aiming for. We’re still going through some testing periods, but so far this has been the closest we’ve managed to get when comparing against Jira’s logic.

Target (-2mo)
CASE 
WHEN [Measures].[Average seconds (up to the second-to-last month)] > 0
THEN
  -- weeks
  Cast(
    Int([Measures].[Average seconds (up to the second-to-last month)] / 604800) AS STRING
  ) || "w " ||
  
  -- days
  Cast(
    Int(
      ([Measures].[Average seconds (up to the second-to-last month)] - 
        Int([Measures].[Average seconds (up to the second-to-last month)] / 604800) * 604800
      ) / 86400
    ) AS STRING
  ) || "d " ||
  
  -- hours
  Cast(
    Int(
      ([Measures].[Average seconds (up to the second-to-last month)] - 
        Int([Measures].[Average seconds (up to the second-to-last month)] / 86400) * 86400
      ) / 3600
    ) AS STRING
  ) || "h " ||
  
  -- minutes
  Cast(
    Int(
      ([Measures].[Average seconds (up to the second-to-last month)] - 
        Int([Measures].[Average seconds (up to the second-to-last month)] / 3600) * 3600
      ) / 60
    ) AS STRING
  ) || "m " ||
  
  -- seconds
  Cast(
    Int(
      [Measures].[Average seconds (up to the second-to-last month)] - 
      Int([Measures].[Average seconds (up to the second-to-last month)] / 60) * 60
    ) AS STRING
  ) || "s"
ELSE
  NULL
END
Maximum (Target +20%)
CASE 
WHEN [Measures].[Average seconds (up to the second-to-last month)] > 0
THEN
  -- weeks
  Cast(
    Int(
      [Measures].[Average seconds (up to the second-to-last month)] * 1.2 / 604800
    ) AS STRING
  ) || "w " ||
  
  -- days
  Cast(
    Int(
      ([Measures].[Average seconds (up to the second-to-last month)] * 1.2 - 
        Int(
          [Measures].[Average seconds (up to the second-to-last month)] * 1.2 / 604800
        ) * 604800
      ) / 86400
    ) AS STRING
  ) || "d " ||
  
  -- hours
  Cast(
    Int(
      ([Measures].[Average seconds (up to the second-to-last month)] * 1.2 - 
        Int(
          [Measures].[Average seconds (up to the second-to-last month)] * 1.2 / 86400
        ) * 86400
      ) / 3600
    ) AS STRING
  ) || "h " ||
  
  -- minutes
  Cast(
    Int(
      ([Measures].[Average seconds (up to the second-to-last month)] * 1.2 - 
        Int(
          [Measures].[Average seconds (up to the second-to-last month)] * 1.2 / 3600
        ) * 3600
      ) / 60
    ) AS STRING
  ) || "m " ||
  
  -- seconds
  Cast(
    Int(
      [Measures].[Average seconds (up to the second-to-last month)] * 1.2 - 
      Int(
        [Measures].[Average seconds (up to the second-to-last month)] * 1.2 / 60
      ) * 60
    ) AS STRING
  ) || "s"
ELSE
  NULL
END
Completed (-1mo)
CASE 
WHEN [Measures].[Average seconds (up to the previous month)] > 0
THEN
  -- weeks
  Cast(
    Int([Measures].[Average seconds (up to the previous month)] / 604800) AS STRING
  ) || "w " ||
  
  -- days
  Cast(
    Int(
      ([Measures].[Average seconds (up to the previous month)] - 
        Int([Measures].[Average seconds (up to the previous month)] / 604800) * 604800
      ) / 86400
    ) AS STRING
  ) || "d " ||
  
  -- hours
  Cast(
    Int(
      ([Measures].[Average seconds (up to the previous month)] - 
        Int([Measures].[Average seconds (up to the previous month)] / 86400) * 86400
      ) / 3600
    ) AS STRING
  ) || "h " ||
  
  -- minutes
  Cast(
    Int(
      ([Measures].[Average seconds (up to the previous month)] - 
        Int([Measures].[Average seconds (up to the previous month)] / 3600) * 3600
      ) / 60
    ) AS STRING
  ) || "m " ||
  
  -- seconds
  Cast(
    Int(
      [Measures].[Average seconds (up to the previous month)] - 
      Int([Measures].[Average seconds (up to the previous month)] / 60) * 60
    ) AS STRING
  ) || "s"
ELSE
  NULL
END

In any case, I am very grateful for all the help and guidance the team and @janis.plume has given me. The ideas and suggestions you share are always essential in helping us improve the use of the tool.

Take a look at the solution above and see what you think, see you later!

Best Regards,
Emerson Soares da Silva

Hi @emersonsoaresdasilva

Thank you for sharing your solution!

If performance is acceptable and the results match your expectations, you can continue using it.

If you notice any performance issues as your data grows, you can consider exploring the Issue Cycle solution as well.

I just have a question regarding concatenating your results and transforming them to minutes/hours/days and weeks. Did you do this to specifically be able to show the results as weeks as well?
The reason I ask is because if you only transformed your calculated results to seconds (by multiplying the day values by 24 and 60 - to transform to seconds), you could have chosen the formatting → Duration. However, it only allows to display days, hours and minutes. If it’s crucial for you to also show the Weeks - this is a very good workaround! Well done!

I have also passed your thanks to Jānis Plūme!

Best wishes,

Elita from support@eazybi.com

1 Like

Hi @Elita.Kalane,

Yes, we applied this approach because, with the current Duration formatting, we couldn’t find an option that also covers weeks. Since our use case requires displaying longer time spans, including weeks, the concatenation method ended up being the most practical solution.

And just as feedback for your team: having support for weeks (and possibly longer durations) directly in Duration formatting would help a lot.

Appreciate your support!

Best regards,
Emerson Soares da Silva