Hi there,
I am currently looking into creating a JIRA KPI dashboard using eazyBI reports.
There are two figures I am interested in and they are fairly common I think.
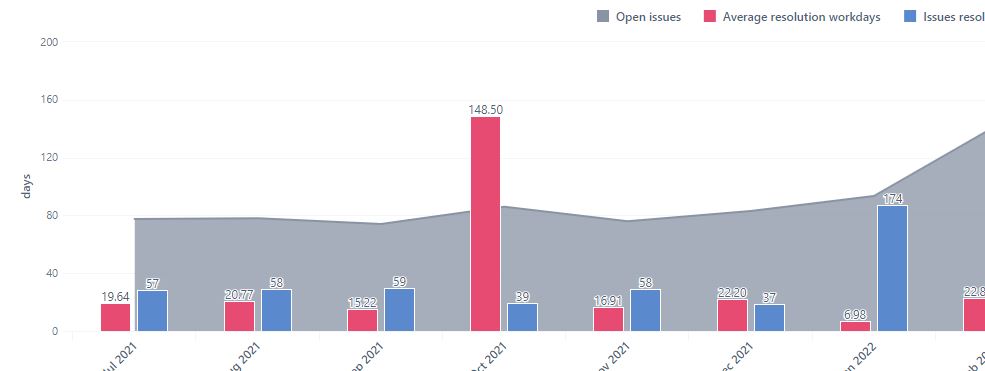
1st Average days to resolve tickets per month (from ticket created until resolved)
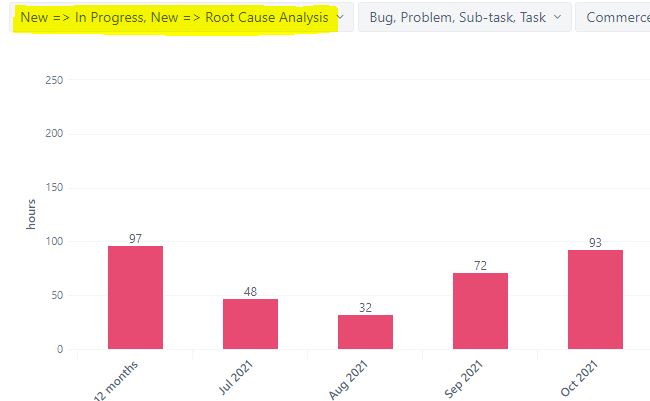
2nd Average hours to start tickets per month (from ticket created until in status “In Progress”)
For 1st I use the measure “Average resolution workdays”.
For 2nd I created a custom measure like this:
[Measures].[Average workdays in transition status] * 8
I know that on the import settings I can set non-working weekdays and also list additional non-working
days like bank holidays. That is fine.
What I don’t know is how to set the office hours, something like 9am to 5pm.
The reason I’d like to have this is that if a ticket is created at 8pm the response time should not start
until the next working day, so from 9am next day.
Is there a setting for this, or if not could someone confirm to me which hours of the day are considered
in the workdays? Basically at what time does the working day start and end in that formula.
Thanks a lot!
Best regards
Nikola
Hi @nikola.kuzmic ,
Are you on Jira Cloud? In that case, you can use the new eazyBI function DateDiffWorkhours() where it is possible to define workhours.
If you are on Server/Data Center, then you need to wait till eazyBI version 6.5 where this function will be included.
best,
Gerda // support@eazyBI.com
Hi @gerda.grantina ,
I am using the cloud version so the function you mentioned is available.
Would you be able to let me know how I could turn the standard calculation for
“Average resolution workdays” which looks like this:
CASE WHEN [Measures].[Issues resolved] > 0 THEN
[Measures].[Total resolution workdays] / [Measures].[Issues resolved]
END
into a formula that uses the DateDiffWorkdays() function.
I was only able to do this for single records, not for all records on a monthly basis.
Please find attached a screenshot of how the chart looks like in the end.
For the second chart I have created a user-defined measure called “Average response time”
that looks like this (assuming the workdays are defined with 8 office hours):
[Measures].[Average workdays in transition status] * 8
For this I have also attached a screenshot that show how I selected the status transitions I am
interested in.
If both these use-cases could be implemented with DateDiffWorkhours(), that would be great!
Thank you.
Best regards
Nikola
Hi @nikola.kuzmic ,
Great news about you being on Cloud!
To have an average response time, you can use the function Avg() together with DateDiffWorkhours().
Here is the formula that is filtering issues by the transition date to status “In progress” and calculates the average between issue’s creation date and the transition date to in progress:
- “67” indicates Saturday and Sunday as non-working days or use “default” to take into account options defined in Time dimension import options
- fourth argument “9-17” indicates business hours.
Avg(
  Filter(
    Descendants([Issue].CurrentMember, [Issue].[Issue]),
      DateInPeriod(
        ([Measures].[Transition to status first date],
        [Transition Status].[In Progress]),
        [Time].CurrentHierarchyMember
      )
  ),
  DateDiffWorkHours(
    [Measures].[Issue created date],
    ([Measures].[Transition to status first date],
      [Transition Status].[In Progress],
      [Time].CurrentHierarchy.DefaultMember),
      '67',
      '9-17'
  )
)
best,
Gerda // support@eazyBI.com
Thank you @gerda.grantina , works like a charm.
Best regards
Nikola
1 Like