Hi guys,
I am using a Line Chart in EazyBI for any completed issues.
But since it’s just Jan 2024, the chart shows only Jan 2024.
Is there a way to show all other months (Feb~Dec) in the chart?
Thank you!
-Kyung
Hi guys,
I am using a Line Chart in EazyBI for any completed issues.
But since it’s just Jan 2024, the chart shows only Jan 2024.
Is there a way to show all other months (Feb~Dec) in the chart?
Thank you!
-Kyung
Are you using time as a dimension? If so, you can filter time by clicking on it. set the filter to before “2024/1/1”
Hi @EdP
I am using time as a dimension.
You mention that set the filter to before “2024/1/1”, but what I want to see is “2024/1/1 ~ 2024/12/31”.
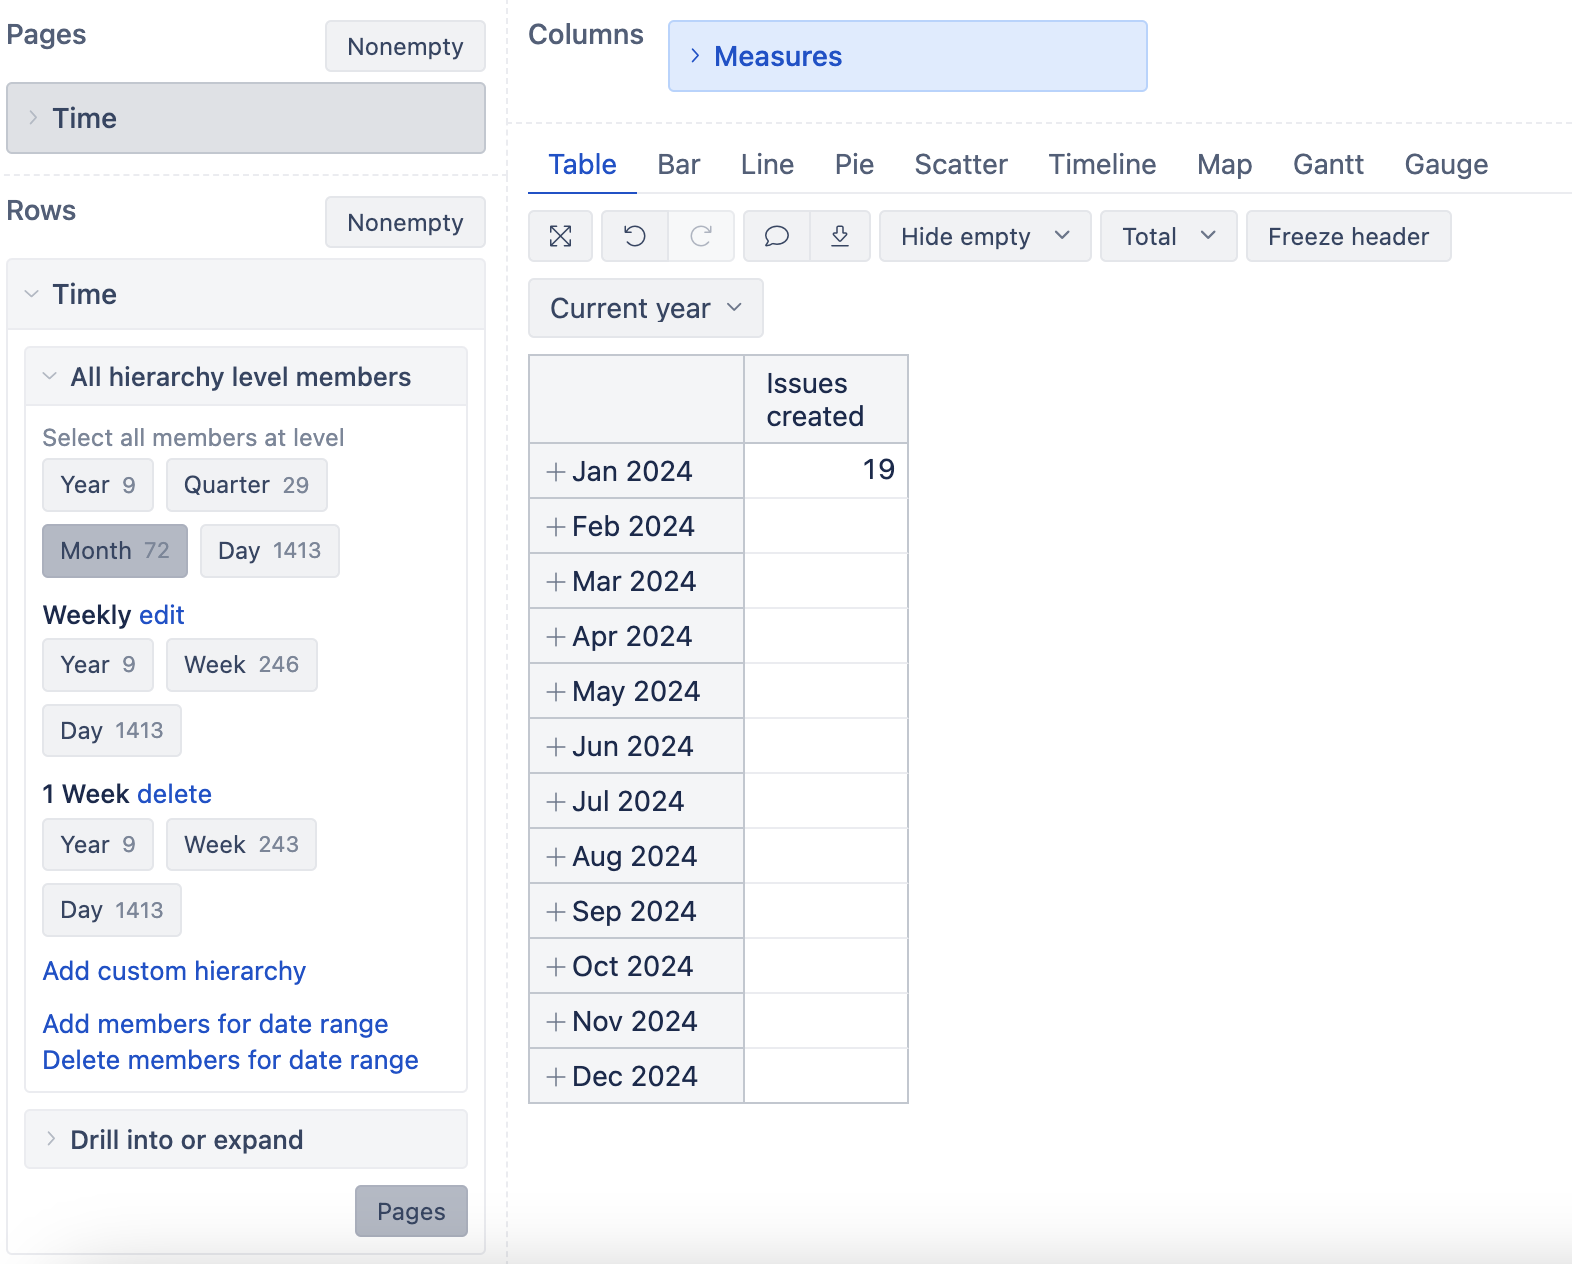
For more information, this is what I have now:
I need to see Jan 2024 ~ Dec 2024 even though there’s no data for Feb ~ Dec.
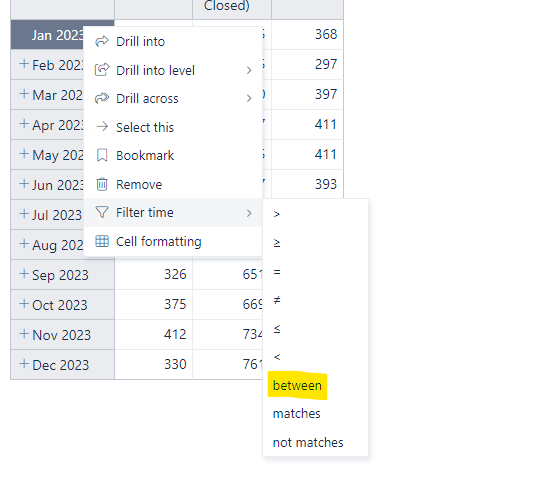
When you left click on the time element, you should see the screen above. When you select between, you should get this box:
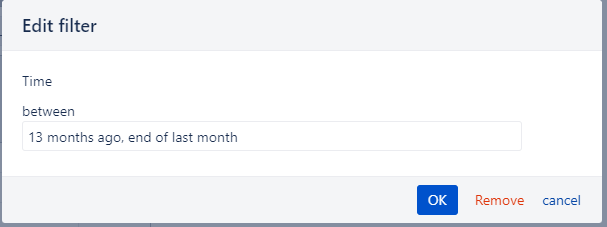
so you would enter (literally, including quotes and the word and):
“2024/01/01” and “2024/12/31”
Hello @Kyung_Park,
Thank you for posting your question!
By default, eazyBI does not generate Time dimension members if there are no values to display. This means that normally you would only see dates where there are some values entered. There is a way to work around this default setup.
As a first step, I would suggest adding Time in Rows and Pages. This will allow you to filter the data by “Current year”.
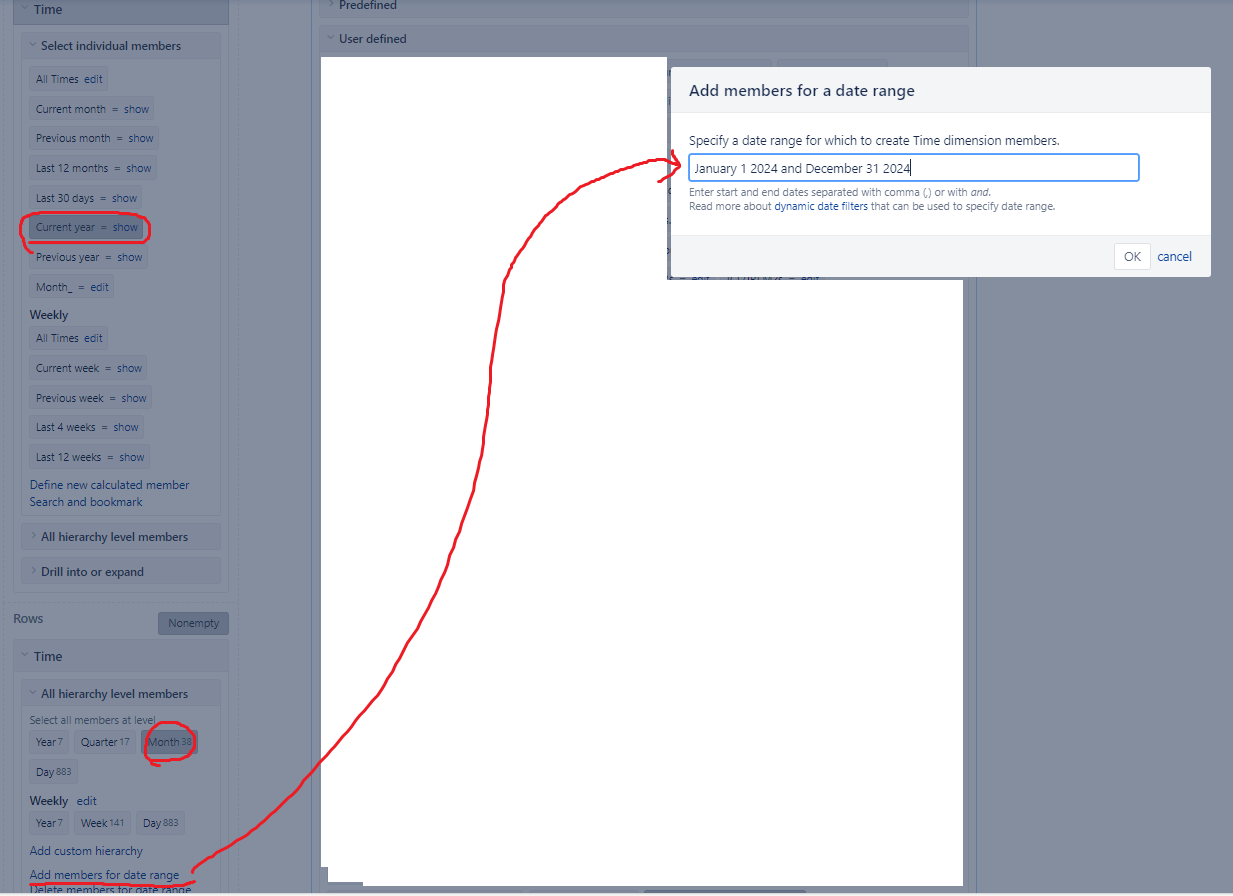
Choose the necessary hierarchy in Rows, e.g., Month.
Then add members for the date range: Time dimension
You should be able to get a similar report, returning dates even if there are no values.
I hope this helps!
Best,
Marita // support@eazybi.com
Thanks for the working around solution.
I have tried following your instruction to generate all other months in 2024, but no luck on my end.
So what I did was:
But nothing has really happened.
Am I missing something?
Hi @Kyung_Park ,
You need to unselect “Nonempty” from the Rows & it should solve the issue.
Best,
Marita // support@eazybi.com