Hi,
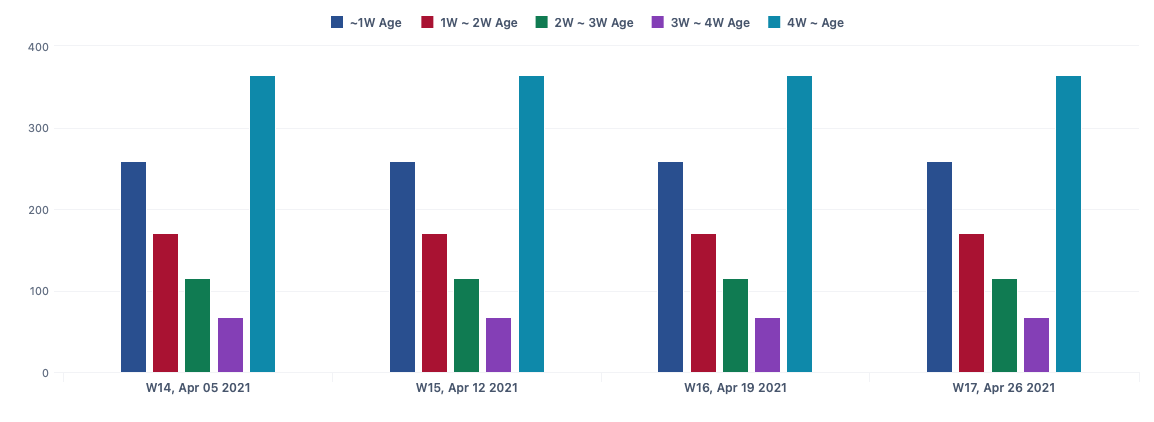
How to show bar chart against number of open issues by age (such as under 1W, 1W ~ 2W, over 2W) over time.
I attached an image what I want to express.
Many thanks,
Terry
@janis.gulbis Could you put this to the right person who can help me?
Our important customer, a division of Samsung Electronics, really need this analysis result.
Many thanks,
Terry from Korea
Hi @Terry ,
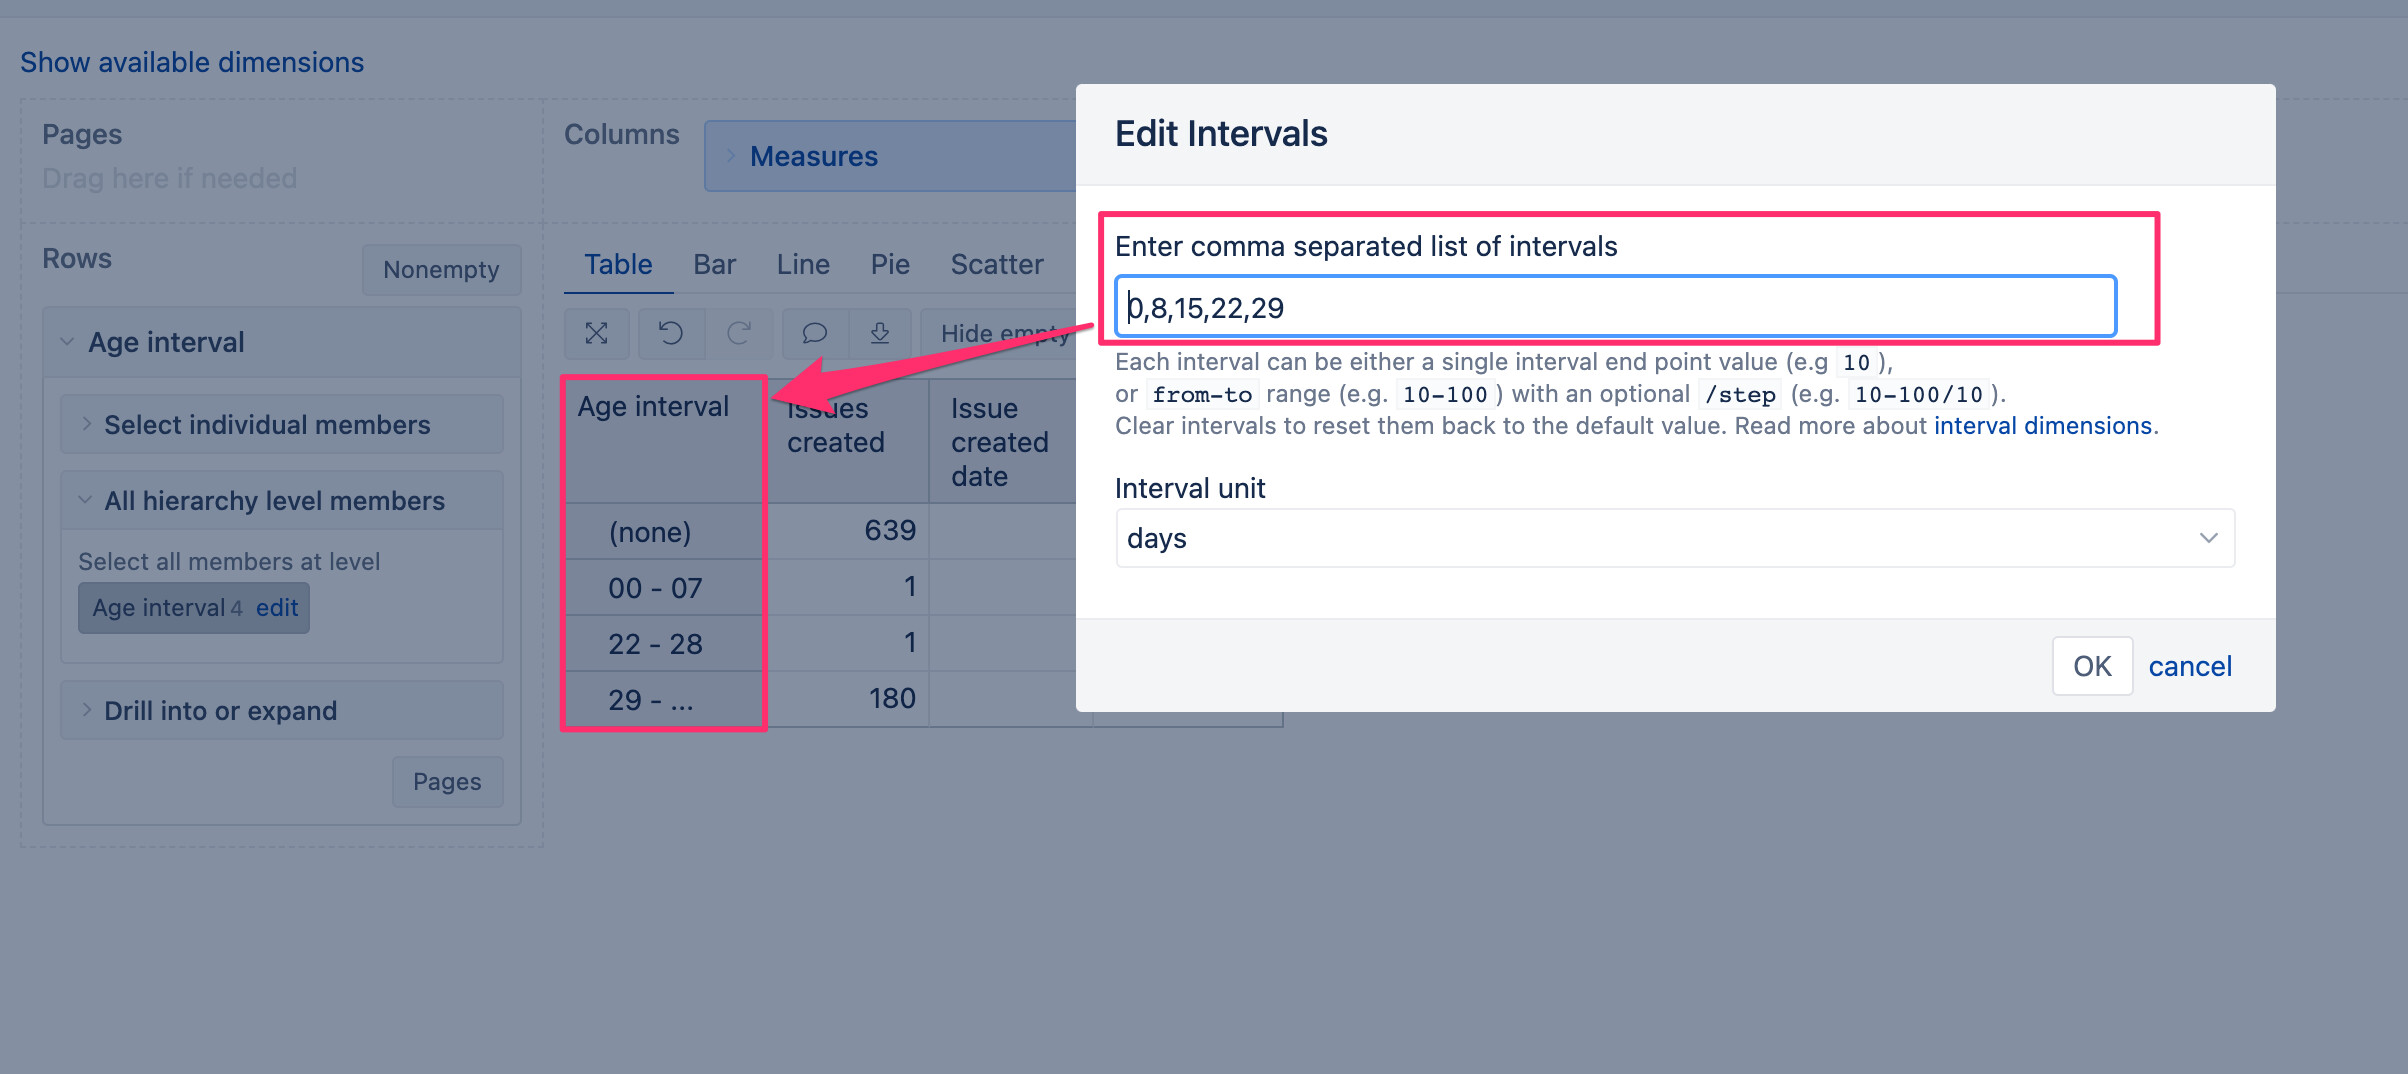
You can create Age interval dimension for this use case. See in in eazyBI documentation how to import Age interval: Jira Issues Import - eazyBI for Jira
To define one-week intervals, you need to use this in the configuration 0,8,15,22,29
See more on how to define different intervals here: Interval dimensions - eazyBI
Also, there is an example report from the eazyBI demo that uses age interval: Unresolved issues by age interval and priority - eazyBI for Jira
best,
Gerda // support@eazyBI.com
Hi @Terry ,
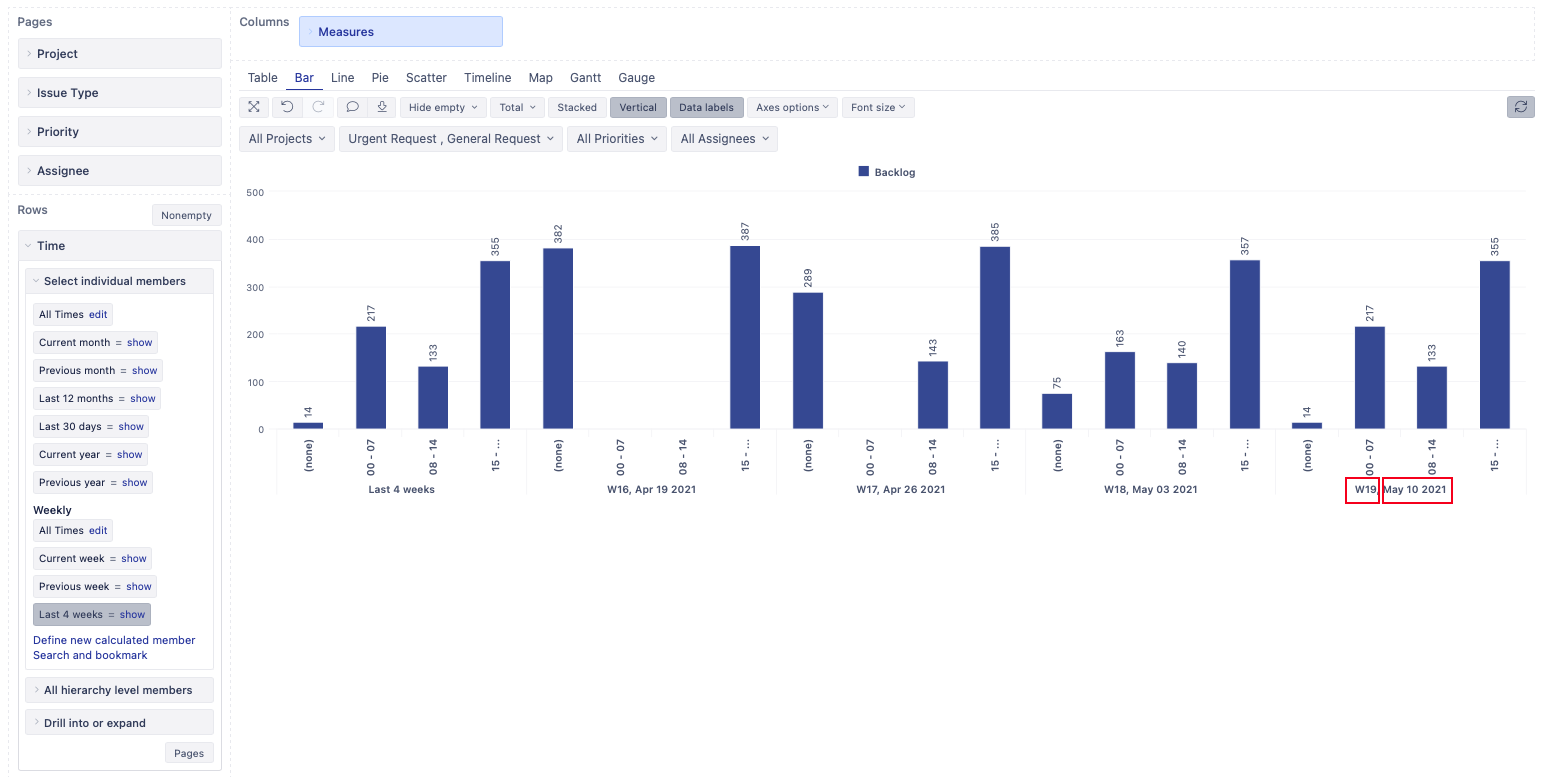
eazyBI uses the EU standard calendar where May 10 is W19. US calendar uses different counting and we have a feature request to support it as well, see related community:
best,
Gerda