My project requirement is that, all the user stories for upcoming release will have a Fix Version field updated with that release date. When the UAT begins, all the UAT defects logged for that release will have the Affects Version updated with that release date.
For Ex:
Release Date : 04/01/2020
User Story for the release will have Fix Version =04/01/2020 and Affects Version= blank.
If a defect is logged in UAT period, then that defect’s Affects Version should be that release date value - 04/01/2020 and Fix version to be =blank.
This is the pattern followed for the last 4 years.
Now I am planning to generate a UAT report release Fix version (row wise) and two columns to display the no of stories and another column for no of defects found in that same UAT period.
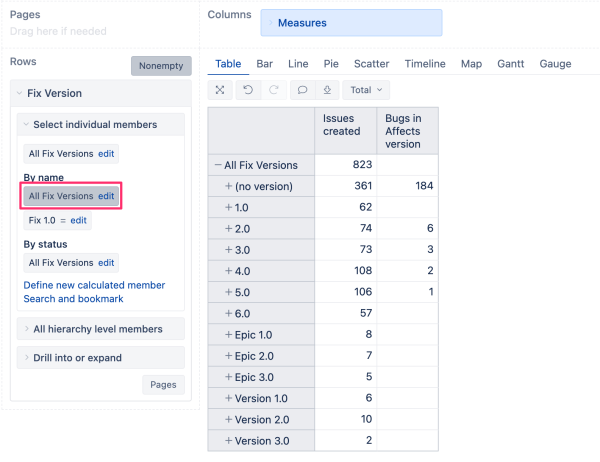
Something like this
Fix Version | No Of Stories | No Of Defects
01/01/2020 | 20 | 45
04/01/2020 | 20 | 45
05/01/2020 | 20 | 45
06/01/2020 | 20 | 45
07/01/2020 | 20 | 45