Hi Mark,
I am not sure the scatter chart would be that flexible.
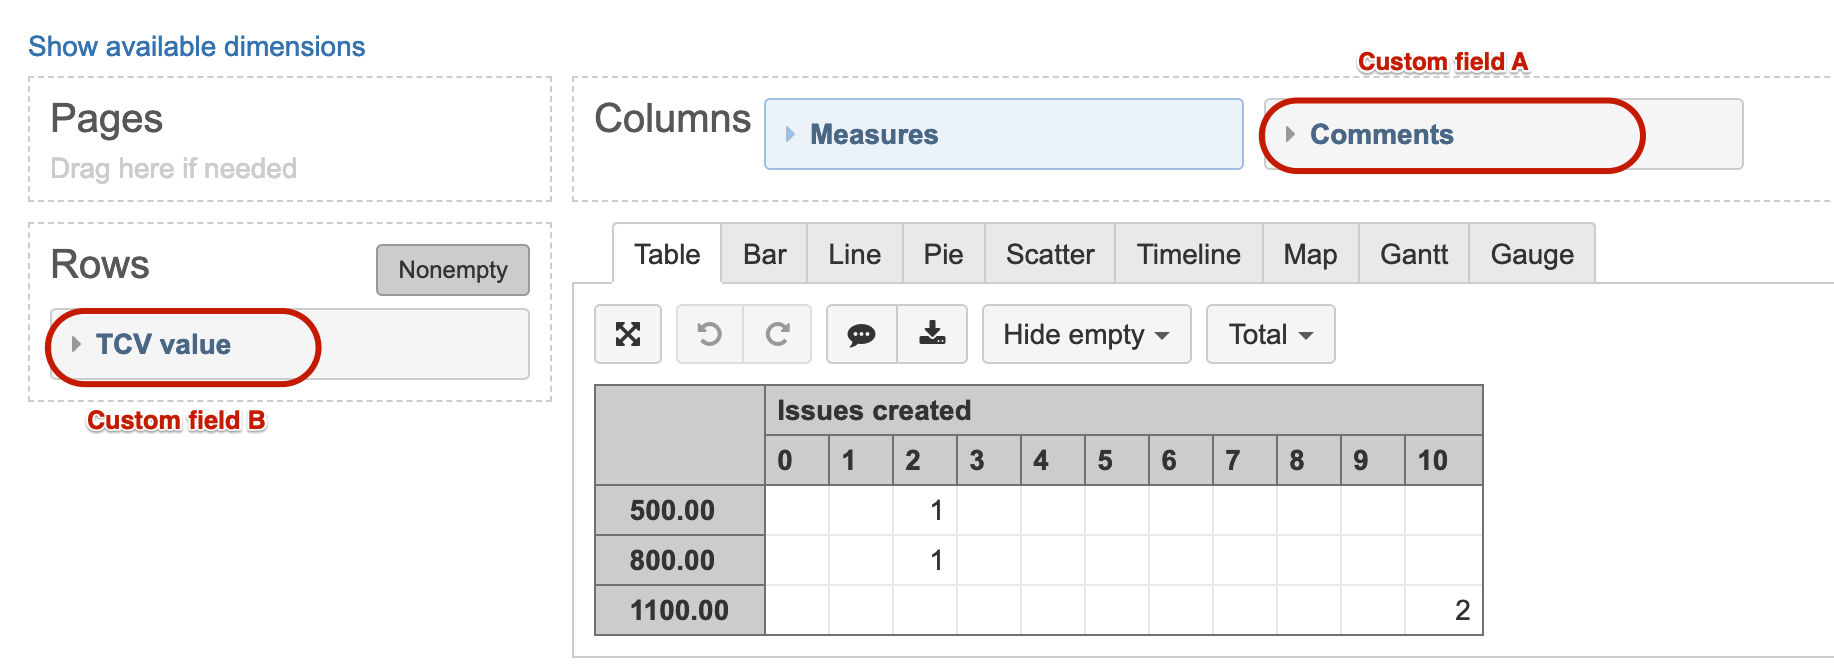
The closest workaround I found is a table report view after you define your custom fields via eazyBI advanced settings to import both of them as dimensions and then use in separate axis
Otherwise, the behavior in scatterchart is as you describe - issues would overlap in case of identical values in both custom fields.
Martins / eazyBI support