Hi,
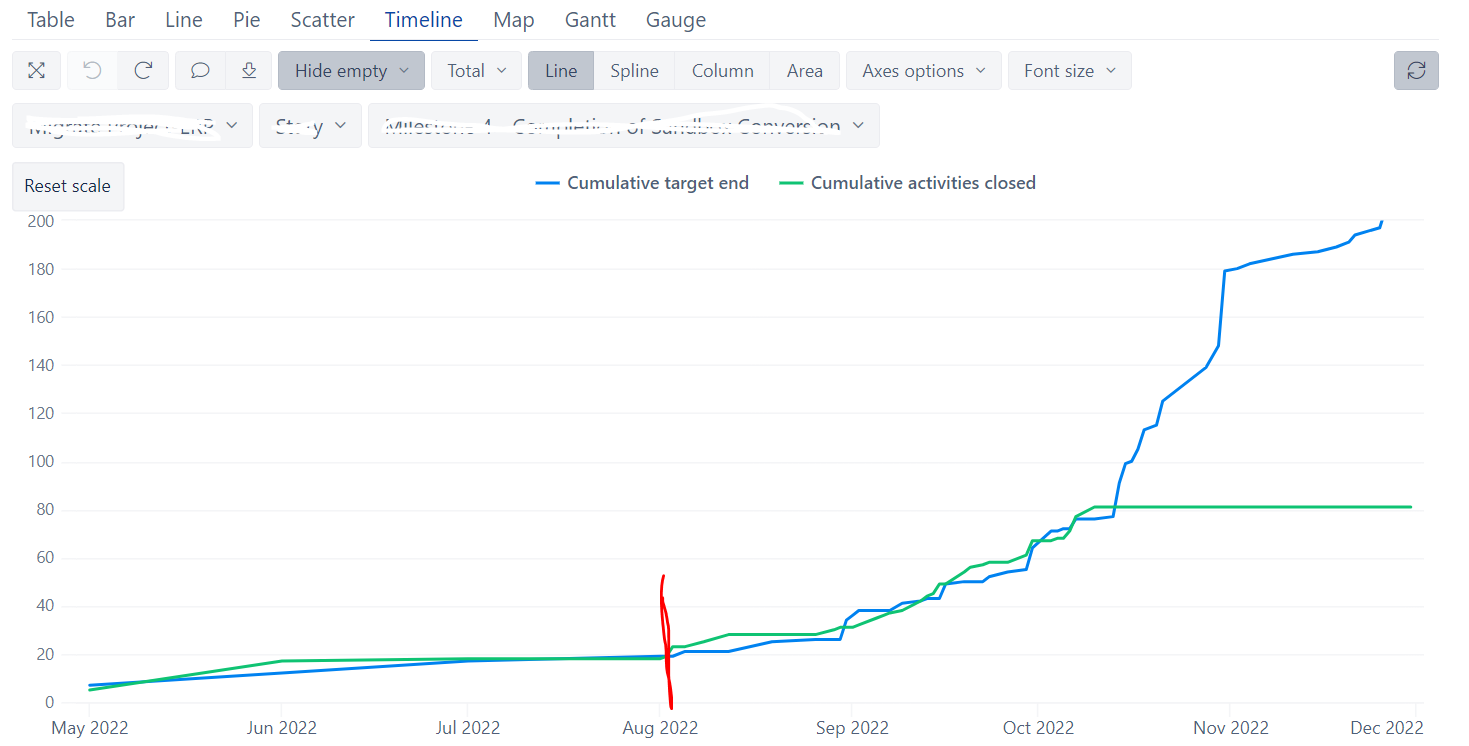
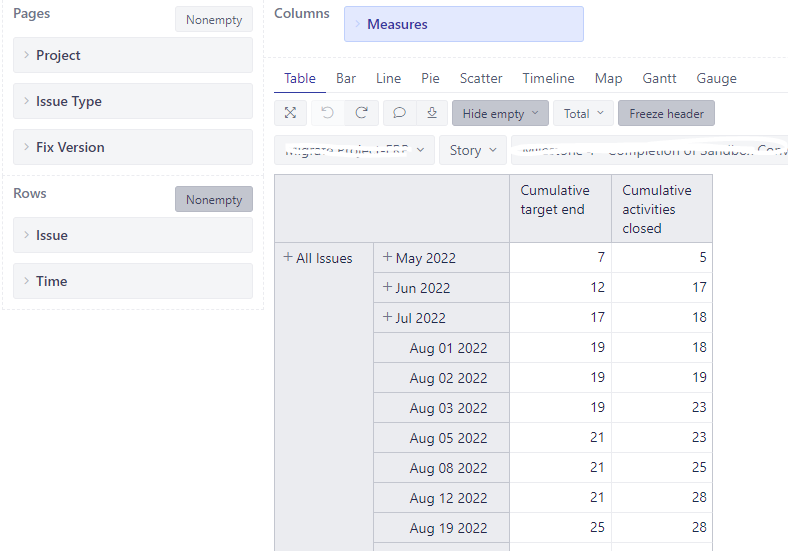
Here I built a burn up chart showing issues planned vs closed which is as below:
image|690x482
I would like to further improve it, so here are two questions:
1, Timeline graph is used, is there a way that its only showing period August onwards?
I did try to use filter on time dimension, however if May-July is filtered out, the cumulative issue counting s start from 1st August. How to include issued in May-Jul but not showing in the graph?
2, anyhow I can stop the Greenline in the graph on today’s day? It doesn’t add any value to show a flat line there.
Currently calculated member is a simple cumulative count.
nonzero(
Cache(
Sum({PreviousPeriods([Time].CurrentHierarchyMember),
[Time].CurrentHierarchyMember},
[Measures].[Issues resolved]
)
)
)
Thanks!