Hi everybody,
I would like to show to my team the average, the minimum and the maximum number of issue created.
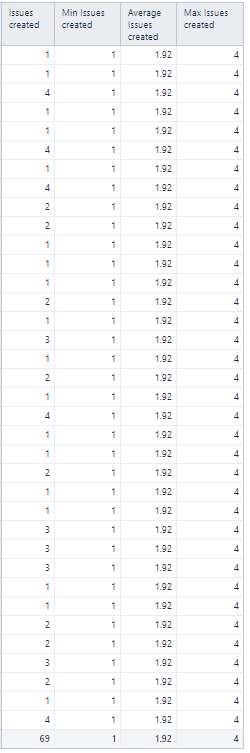
This is the table:
And the information that I would like to show on the “Gauge” report is only on the last row (corresponding to the total of rows)
For the moment, I have multiple data for each component…
Do somebody have the answer?
Thank’s a lot 
Muriella
Hi @Muriella,
You can create an Aggregate(…) in the dimension you use with the members you wish to see the values from and only use that instead of the Total row.
Lauma / support@eazybi.com
Hi @lauma.cirule,
I tried but it didn’t work. Can you please give me an example?
Muriella
Hi @Muriella,
Could you please send more details to support@eazybi.com? What did you try and what did not work as expected.
Please, also export report definition and attach to the e-mail.
Lauma / support@eazybi.com