Hi there and Happy Friday!
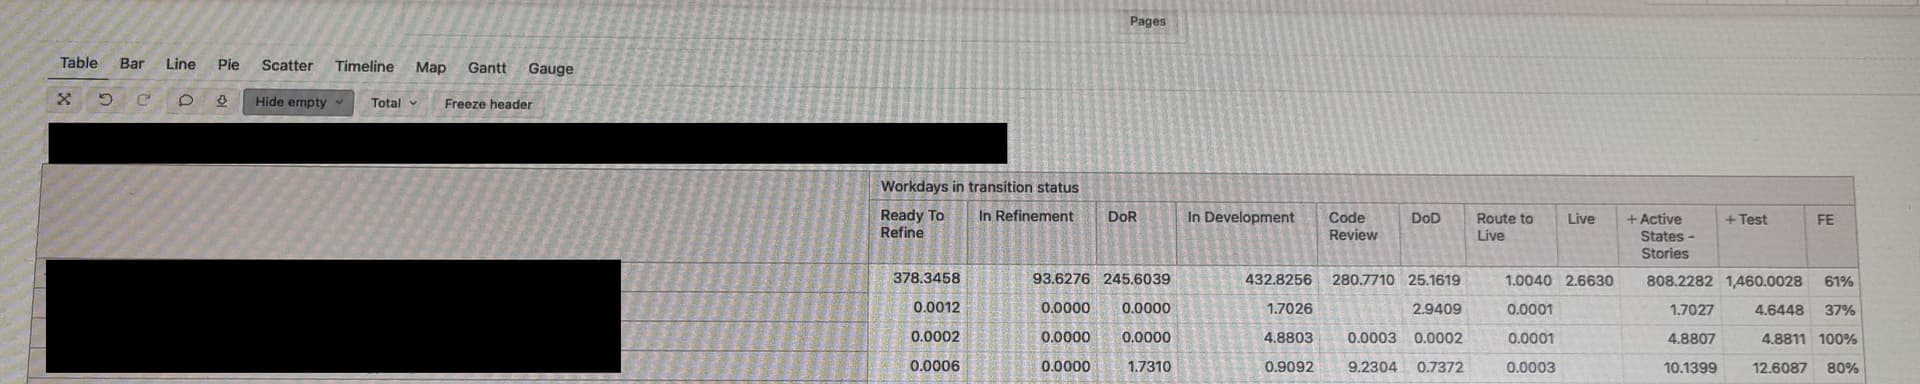
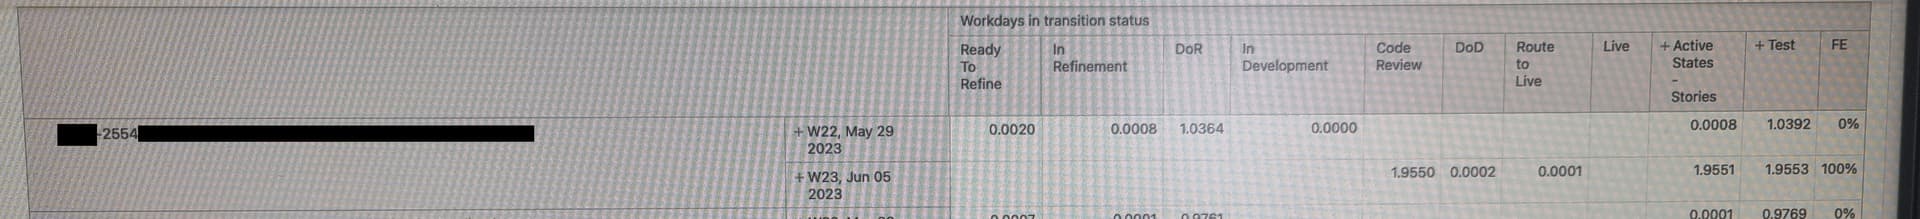
I’m trying to build a report that would show a Flow Efficiency of issues moved to Live status per week / month. I was able to use the combination of “Workdays in transition status” and different “Transition Status” measures to display the time in each transition status for all issues in the last status (“Live”). From there, I was able to calculate the Flow Efficiency for each issues (see screenshot below). This is where I’m stuck currently. I’d like to plot the flow efficiency of issues that were moved to “Live” status in a particular week / month. However, when I use the Time dimension and plot the flow efficiency against weeks / months, the Flow Efficiency is only measured for Transition Statuses that an issue used in that week / month (see screenshots 2 with the right results and 3 when used with Time dimension). What I’d like to see is, for example:
When an issue was moved to the “Live” status in July 2023, it should capture the “Workdays in transition” for each Transition Status. It should then Calculate the sum of all workdays that the issue was in Active Transition States (defined as a calculated measure) and divide this number by the total number of workdays for all Transition States (defined as a calculated measure). This should give a Flow Efficiency measure. That measure should then be displayed in July 2023 month rather than any other month if the issue had been worked in in June and July.
Would anyone be able to help please? ![]()