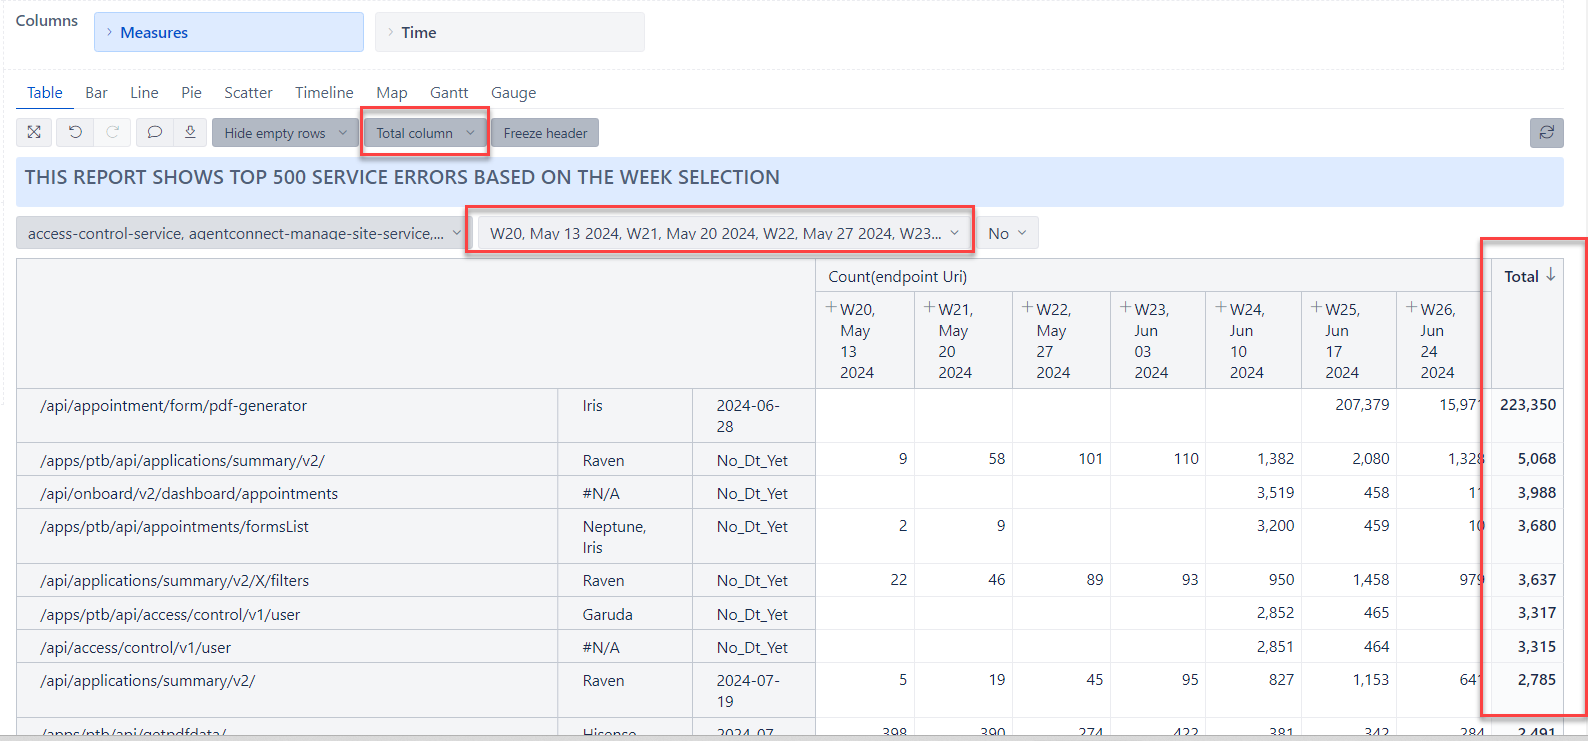
As you see in my screenshot, you can see all the weeks in column that shows the count of certain log events occured every week. As the weeks pass by, I select corresponding weeks to show in the column. My request for help is for 2 questions.
- How to create a measure that sum up the displayed columns ( based on the page filtering values i select)?
- How to rank that sum up value Largest to Smallest by showing only top 20 records?
- Right now, you can see i used the standard Total option and that column do not provide much options to filter the row count.
Hi @subintraj,
You have multiple selections in the Time dimension page filter. Does the selection change dynamically, or do you desire the same number of weeks, for example, the last 7 weeks?
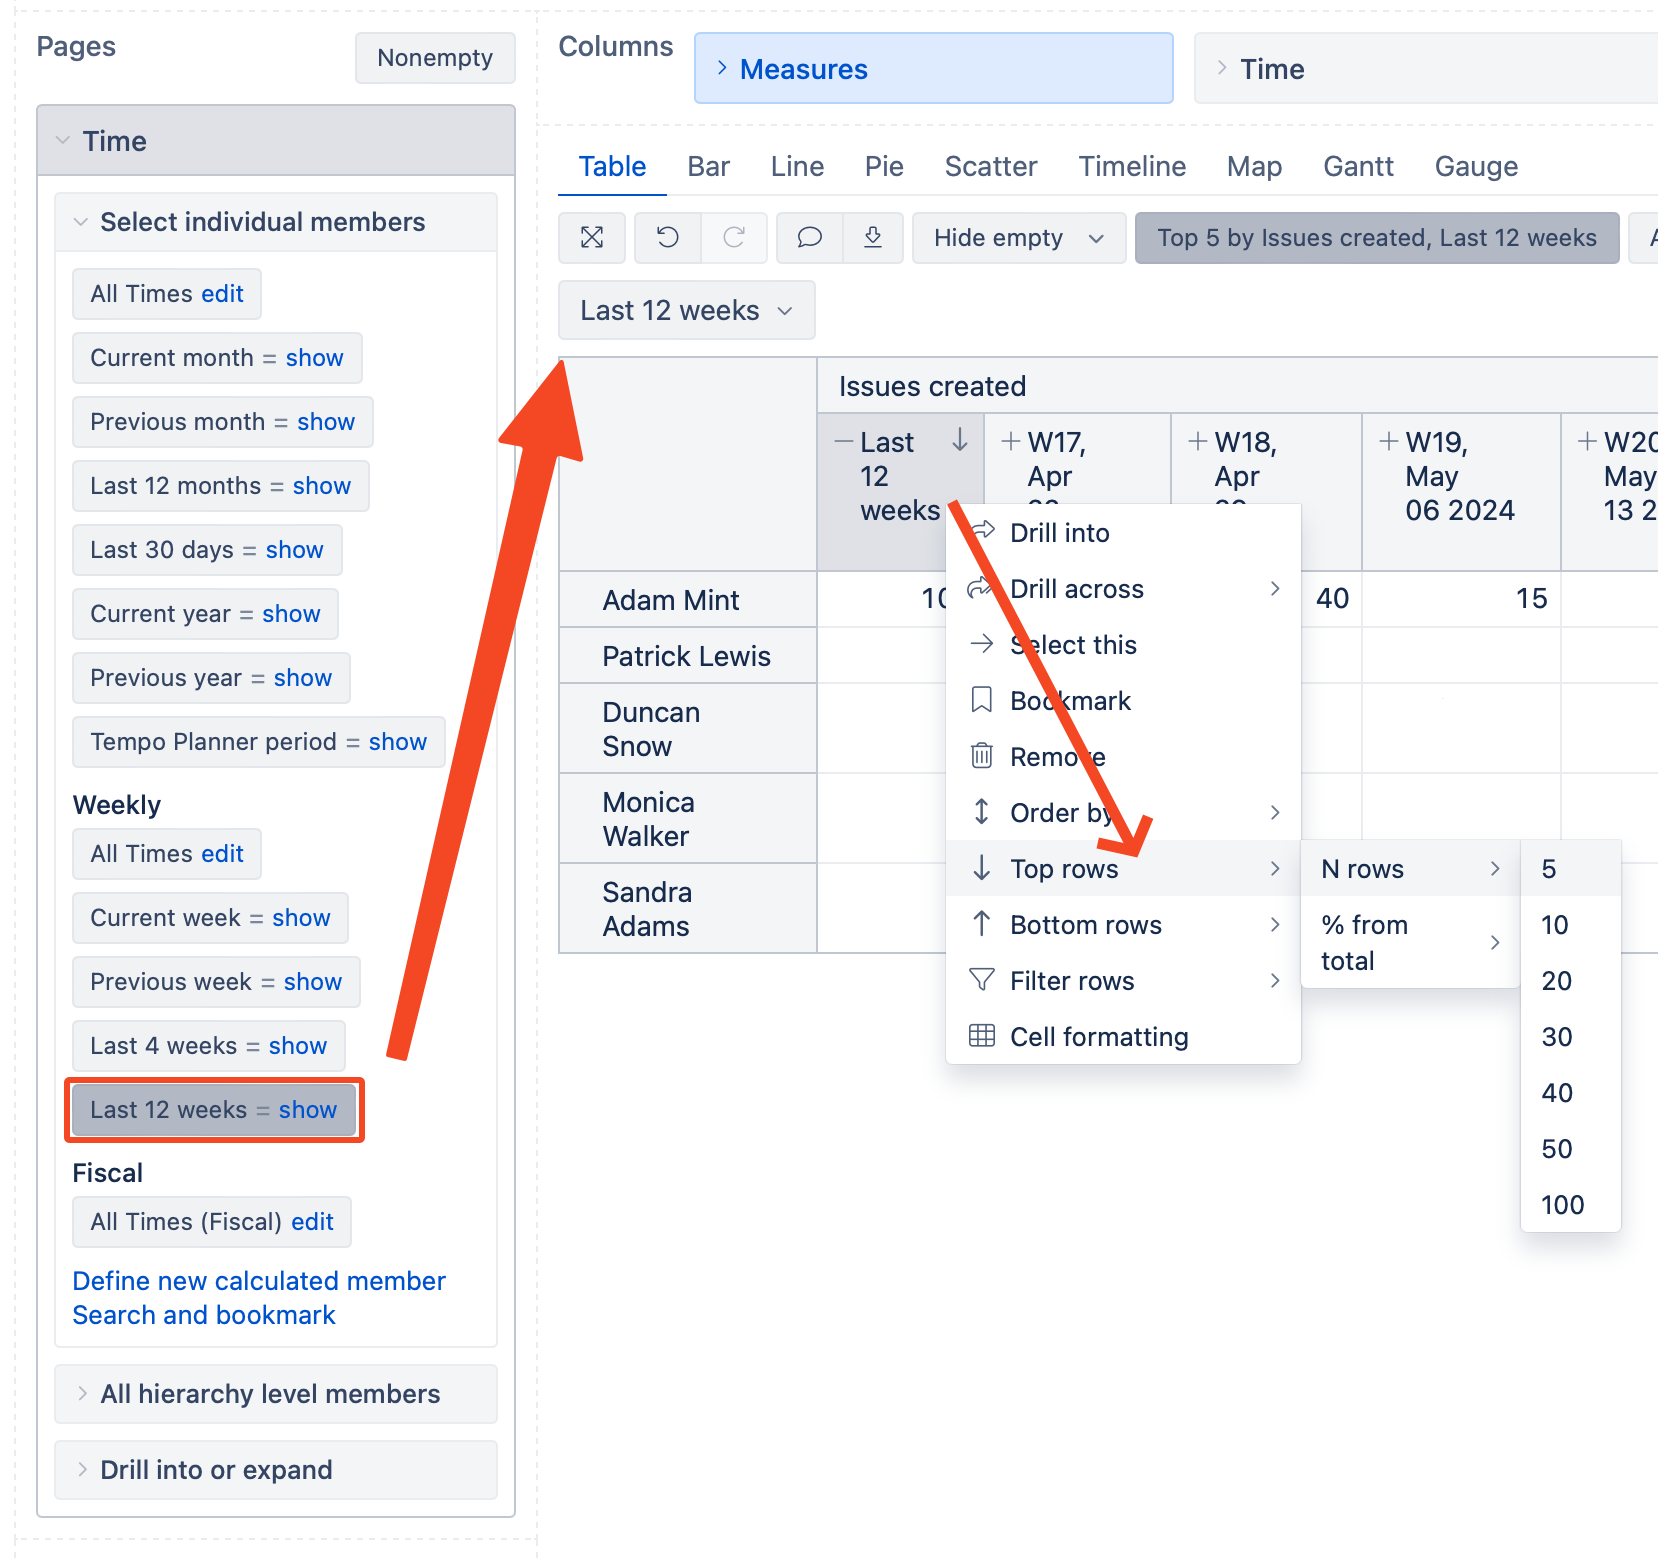
I recommend defining a new calculated member in the Time dimension that aggregates the weeks. See some examples here - Calculated members in Time dimension.
After that, select the new calculated member in pages and columns. You can expand the Time dimension member in columns to view the individual weeks. Then, you can apply the “Top N” filter to the aggregated member. Please see the example below:
Best,
Roberts // support@eazybi.com