How to use MDX to express the number of defects in A status every week
Hi @Shirly,
When analyzing statuses across time, you might want to use measures representing issue history and dimension Transition Status. For example,
- measure “Issues history” to see how many issues were in the status at the end of the week.
- Or measures “Transition to status issue count” to see how many issue entered the specified status
And add the Issue Type dimension on pages to limit reports only to defects.
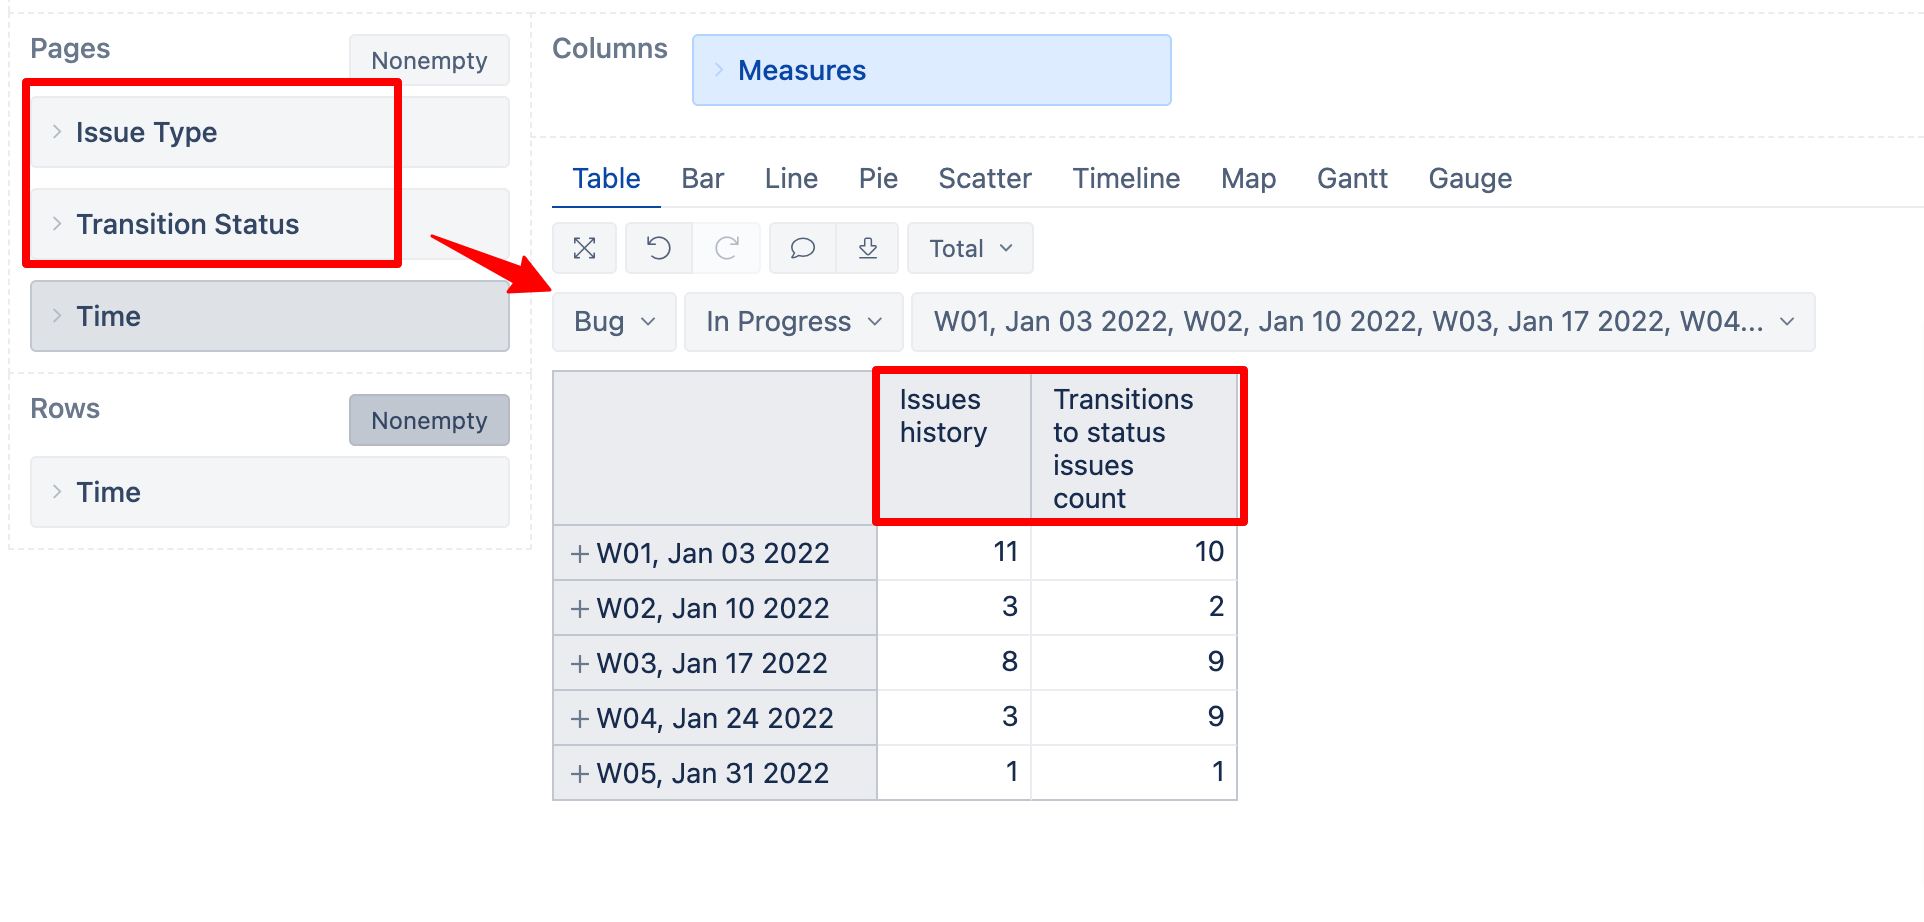
If you wish to create a calculated measure that would show the count of defects in specific transition status, then combine mentioned measures and dimensions into a tuple expression (see documentation: Tuple):
(
  [Measures].[Transitions to status issues count],
  [Transition Status].[In Progress],
  [Issue Type].[Bug]
)
Best,
Zane / support@eazyBI.com
hello, Zane~
The method you mentioned is feasible, but I encountered another problem in the application process. For example, I want to obtain a certain state of the cell: transition and a field value of the problem in this state is limited to > 0, but I don’t know how to describe it in MDX. I hope you can help me. Thank you!
I am sorry, it is not clear to me what you are trying to achieve or how your report looks.
I would recommend starting simply using measures “Issues history” and Transitions from/to status issue count", without any MDX calculation. And use other dimensions (issue type, transition status) as page filters. Here are more details on measures and dimensions designed to analyze issue statute changes: Import issue change history.
If you are new to eazyBI, please watch those short training videos to learn the main principles how to work with ea’zyBI: Training videos
When you see how the data are represented in eazyBI, then you can move forwards with user-defined calculations.
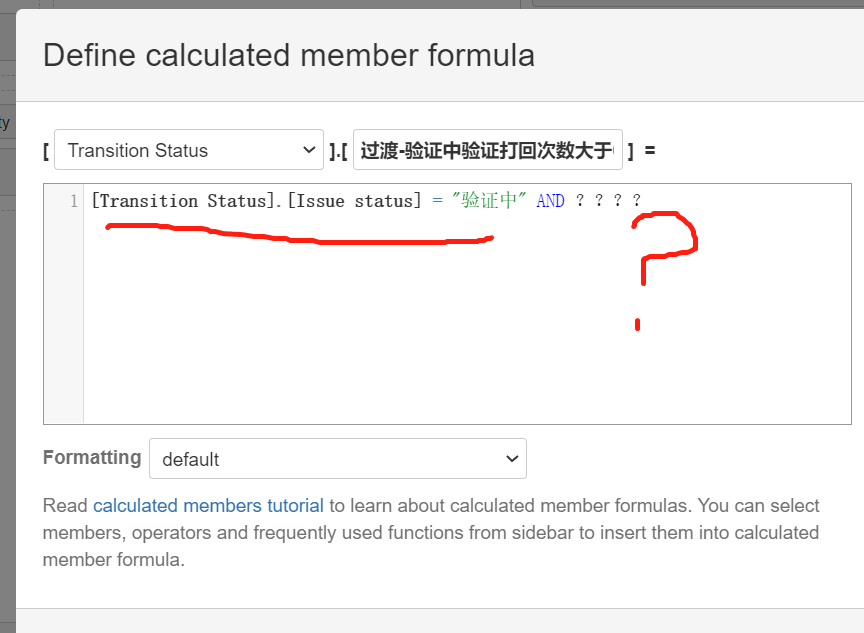
I want to obtain the statistics of the number of questions in the “A” status every week when the B field (numerical type) of the question is > 0,Its semantics are as follows:
[Transition Status].[“A”] AND [Measures].[Issue “B字段”]>“0”
But, [Transition Status] and [Measures] ,they belongs to different dimension calculation cells, and the MDX formula will report an error.
The two dimension calculation cells are both data in the transition period, and neither of them can be filtered by the data source JQL statement. Only MDX formula can be used.
I hope you can understand my needs.
@Shirly thank you for more details. In this case, you might use the combination of Sum() and Filter() functions. The logic is to iterate through all issues, filter them by the details on transition history and custom-defined value, and then sum up the valid issues. The expression might look like this:
Sum(
  -- set of issues that have value for custom field
  Filter(
    --iterate through all issues
    Descendants([Issue].CurrentMember,[Issue].[Issue]),
    --check their custom field value and creation date
    [Issue].CurrentMember.Get('B字段') > 0 AND
    DateBeforePeriodEnd(
      [Issue].CurrentMember.Get('Created at'),
      [Time].CurrentHierarchyMember)
   ),
   CASE WHEN -- issue was in status B at the end of a period
     ([Measures].[Issues history],
     [Transition Status].[B]) > 0
   THEN -- count issue
     1
   END
)
More materials on measures and dimensions representing issue change history, like transition statuses are here: Import issue change history
And on mentioned functions are here: Calculated measures, Filter.