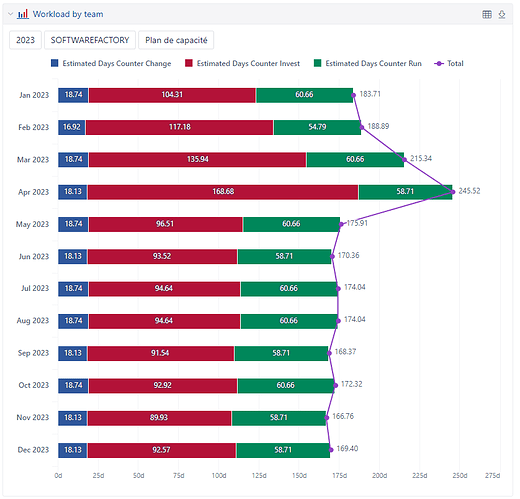
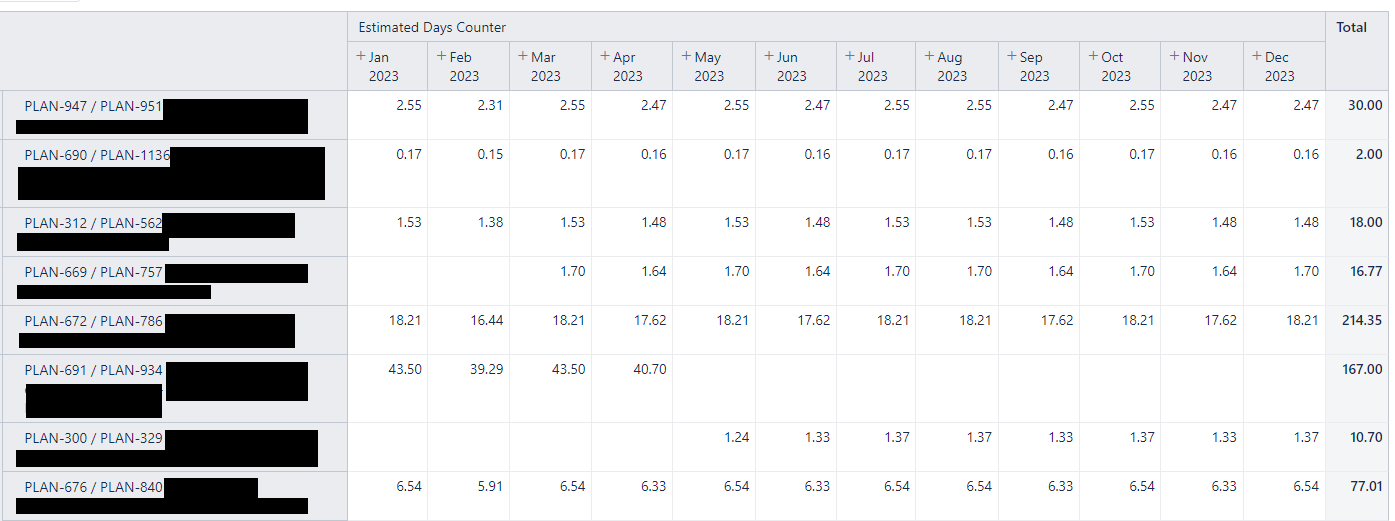
How to use start date custom field as Time?

Hello,

We have two custom fields to track start and end date of a Jira Issue.

We would like to create a report based on Original Estimates Days that is able to create a flat workload on the duration of the issue regarding the mentionned start date and end date.

Is there any feedback on how to create it ?
Thanks a lot for your suggestion.

Hi @pchampet

Could you give a bit more input on the expected outcome of this report?

Do you want to see a list of Jira Issues in Rows with different measures in Columns (including the newly calculated one), or are there some other expectations?

Is the “Original Estimates Days” a custom field in your Jira that holds the number of estimated days, or is it a reference measure to the Predefined “Original estimates hours” measure?

Also, about the calculation - would you like to divide the “Original Estimates Days” count by the number of days/weeks/months between the Start and the End dates, or do you have a different equation in mind?

Thanks!
Nauris

Hi
Thanks for your feedback.

Indeed, our measure “Orginial estimates days” is reference to “Original estimates hours” based on the default number of worked hours in our company.

About the calculation, I think you are correct.
Let me explain with a simple case to be sure we understand each others.

We have an issue with an orginal estimates hours of 100h, the issue have a start date set to 2023/04/01 and end date set to 2023/04/05.
We would like to be able to report that for each day between the start and the end of the issue we consider having an estimate of 100h / 5 days → 20 hours per day.
So if I focus on the 2023/04/01, I have only 20 hours for this issue.
The goal is to be able to consolidate by month or year for instance.

I hope it is clearer.
Let me know if any other information required.

Thanks a lot
Patrice.

Hi @pchampet

Thanks for the clarification on the calculation!

The next thing I would like to understand is- what should the report look like?
Would you like to see a list of issues in the Rows section and a Measures column with the “hours per day” measure for each issue? You could then filter the Issues by created or some other dates by using the Time dimension in the Pages section.

Or would you like to see this plotted on a “timeline”? In this case, how should the hours be plotted on the timeline? If you have months in the Rows section(timeline), how should these hours be counted toward each month?

The calculation of the hours per day can be done in several ways and it all depends on the context of the resulting report, so, to build the formulas, it would be good to know- what the expected report should look like and what will it have in the Rows/Pages/Columns sections.

Thanks!
Looking forward to helping you out!
Nauris

Hi @nauris.malitis

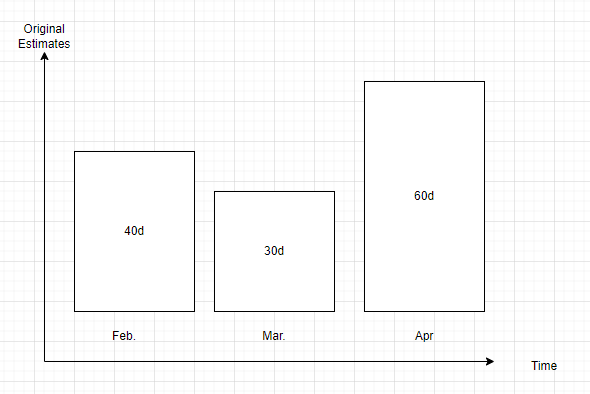
what we have in mind is something like
image

Where we can zoom and consolidate on time to have for instance a view for the month of the current year, or for the whole year.

Our main pain right now is to figure out, how to have theses estimates consolidated by month for instance for an issue with a start date beg. of the year. and an end date that could be end of year.

Is it clearer ?

Thanks a lot for your support !

Hi @pchampet

Thanks for the additional details!

I apologize for the non-stop questions, I just want to be super clear on what the final report should look like.

In your previous example with one issue, you had 100h / 5 days → 20 hours per day. So, when viewing the Day level, it should show 20 for each day from Apr 1st until April 5th, but when viewing the Month level, it should show as 100 for April for this issue?

If the issue would have a start date of 2023/03/30 and end date of 2023/04/03, would you expect in the Month level to see 40 for May and 60 for April for this issue or 100 for May, since the start date is in May?

Also, how should this translate to several issues, should the total amount of days be shown for each month or would you like to see some kind of averages across the issues?

If each month should only show the part of hours that falls in that month, then this formula for each Time member will have to iterate through all the issues and retrieve the “hrs per day” value and multiply it by the number of days for this month that fall between the start and end dates of this issue. Does this sound okay?

Thanks
Nauris

Hi @nauris.malitis

Thank you for your valuable questions!

In your previous example with one issue, you had 100h / 5 days → 20 hours per day. So, when viewing the Day level, it should show 20 for each day from Apr 1st until April 5th, but when viewing the Month level, it should show as 100 for April for this issue?

Yes exactly.

If the issue would have a start date of 2023/03/30 and end date of 2023/04/03, would you expect in the Month level to see 40 for May and 60 for April for this issue or 100 for May, since the start date is in May?

In this case we want to split as mentionned:
If 2 days in mars and 3 days in April for this issue, based on the start and end date, we should have: 40 for Mars and 60 for April

Also, how should this translate to several issues, should the total amount of days be shown for each month or would you like to see some kind of averages across the issues?

We want the amount of days for several issue, we try to consolidate the sum of estimates.
If we have two issue with each 50d as estimates for march, we need to know that there is 100d planned for march

If each month should only show the part of hours that falls in that month, then this formula for each Time member will have to iterate through all the issues and retrieve the “hrs per day” value and multiply it by the number of days for this month that fall between the start and end dates of this issue. Does this sound okay?

Sounds good indeed !

Thanks a lot for your support.

BR,
Patrice.

Hi @pchampet

Thanks for the replies! This helped me understand exactly what you intend to achieve in the report!

For this to work, you should import your custom date fields “Start date” and “End date” into this eazyBI report account. You can select them for import in the import options: Data from Jira

For the “Estimated hour counter” you can define a new calculated measure in the Measures dimension and use the following formula for it:

Sum(
  Filter(
    Descendants([Issue].CurrentMember,[Issue].[Issue]), -- iterate through all issues
    -- select the issues that have started before the end of the month currently in Rows
    DateBeforePeriodEnd(
      [Measures].[Issue Start date],
      [Time].CurrentHierarchyMember
    )
    AND -- and that have also the end date after the end of previous month in Rows
    DateAfterPeriodEnd(
      [Measures].[Issue End date],
      [Time].CurrentHierarchyMember.PrevMember
    )
    AND -- and that also have estimated hours
    (
      [Measures].[Original estimated hours],
      [Time].CurrentHierarchy.DefaultMember
    ) > 0
  ),
  CASE WHEN -- if the issue has started in the current Rows month
  DateInPeriod(
    [Measures].[Issue Start date],
    [Time].CurrentHierarchyMember
  )
  THEN
    CASE WHEN -- and if it has also ended in this Rows month
    DateInPeriod(
      [Measures].[Issue End date],
      [Time].CurrentHierarchyMember
    )
    THEN -- then calculate the days between start and end date
    DateDiffDays(
      [Measures].[Issue Start date],
      [Measures].[Issue End date]
    ) * -- and multiply by estimated hours divided by the total number of days between start and end date
    ([Measures].[Original estimated hours],
    [Time].CurrentHierarchy.DefaultMember) 
    /
    DateDiffDays([Measures].[Issue Start date],
    [Measures].[Issue End date])
    ELSE -- if it has ended in a different(future) month, then calculate the days between start date and end of the month
    DateDiffDays(
      [Measures].[Issue Start date],
      [Time].CurrentHierarchyMember.NextStartDate
    ) *
    ([Measures].[Original estimated hours],
    [Time].CurrentHierarchy.DefaultMember) 
    /
    DateDiffDays([Measures].[Issue Start date],
    [Measures].[Issue End date])
    END
  ELSE -- if the issue has started before the current Rows month
    CASE WHEN -- but it has ended in this Rows month
    DateInPeriod(
      [Measures].[Issue End date],
      [Time].CurrentHierarchyMember
    )
    THEN -- then calculate the difference between the start of the month and the issue end date
    DateDiffDays(
      [Time].CurrentHierarchyMember.StartDate,
      [Measures].[Issue End date]
    ) *
    ([Measures].[Original estimated hours],
    [Time].CurrentHierarchy.DefaultMember) 
    /
    DateDiffDays([Measures].[Issue Start date],
    [Measures].[Issue End date])
    ELSE -- if the issue has started before and ended after the current Rows month, then count the total number of days in month
    DateDiffDays(
      [Time].CurrentHierarchyMember.StartDate,
      [Time].CurrentHierarchyMember.NextStartDate
    ) *
    ([Measures].[Original estimated hours],
    [Time].CurrentHierarchy.DefaultMember) 
    /
    DateDiffDays([Measures].[Issue Start date],
    [Measures].[Issue End date])
    END
  END
)

I’ve added some comments in the formula to describe what is being done in each step, but let me know if you have any additional questions on this!

Things to note:

  • Please make sure that you use the current [Issue Start date] and End date property members, they may have a slightly different name depending on how they are named in your Jira, and you may need to adjust them in the formula (the eazyBI auto-suggest should offer you the correct names when fixing them)
  • Set the Formatting for this formula to Numeric → Decimal
  • This formula uses the DateDiffDays() formula that calculates the total number of days from the first day till the last day. However, it doesn’t include the last date, but from your example, I assume that you want to also include the last date, so there are a bunch of +1’s scattered around the formula to include the end date where it is needed.
  • If you would like to exclude the non-working days from the equation, you can replace the DateDiffDays() function with DateDiffWorkdays() function.
  • This formula returns the sum of Estimations in hours, if you would like to see the sum in days, you can replace all the:
([Measures].[Original estimated hours],
[Time].CurrentHierarchy.DefaultMember)

with:

(([Measures].[Original estimated hours],
[Time].CurrentHierarchy.DefaultMember)/24)
  • As the Issues have no “real” connection to the Date members that they are “passing through” you may want to disable the “Nonempty” option in Rows and use “Hide empty rows” instead to show all the date members between Start and End dates of Issues.
  • If you have some missing dates in your Time dimension (dates that are not present in Jira, thus are missing from the Time dimension), then you can add them manually by clicking the Add members for date range.

Let me know if this works as expected!
Nauris
1 Like

Thanks a lot @nauris.malitis
You made my day !

We are now able to report on the total workload for our teams, by year, by month…

Our next challenge will be to make an external import of teams capacity.
They are now stored in BigPicture Teams.

Once again, thank you so much !

Hi @pchampet

Thanks for the feedback!
I’m glad this works as expected and helps you keep track of workloads! :100:

About the next challenge- I’d recommend checking out if they offer REST API endpoints to retrieve this information.

Here is the documentation page on how to set up the REST API imports in eazyBI: Import from REST API
And here you can read additional information on data mapping: Data mapping

If you need assistance with this, you can contact us at support@eazybi.com with specific details or start a new topic in the Community :speech_balloon:

Best regards,
Nauris