Like talk in this topic : Target Start Old Values - #2 by zane.baranovska
and documented in here : Jira custom fields
I created a measure " Issue Custom field old values" , i want to make a graph where axe X is Time.
And Y i a measure that count 1 everytime i got a Time matching the date in the measure " Issue Target start old values".
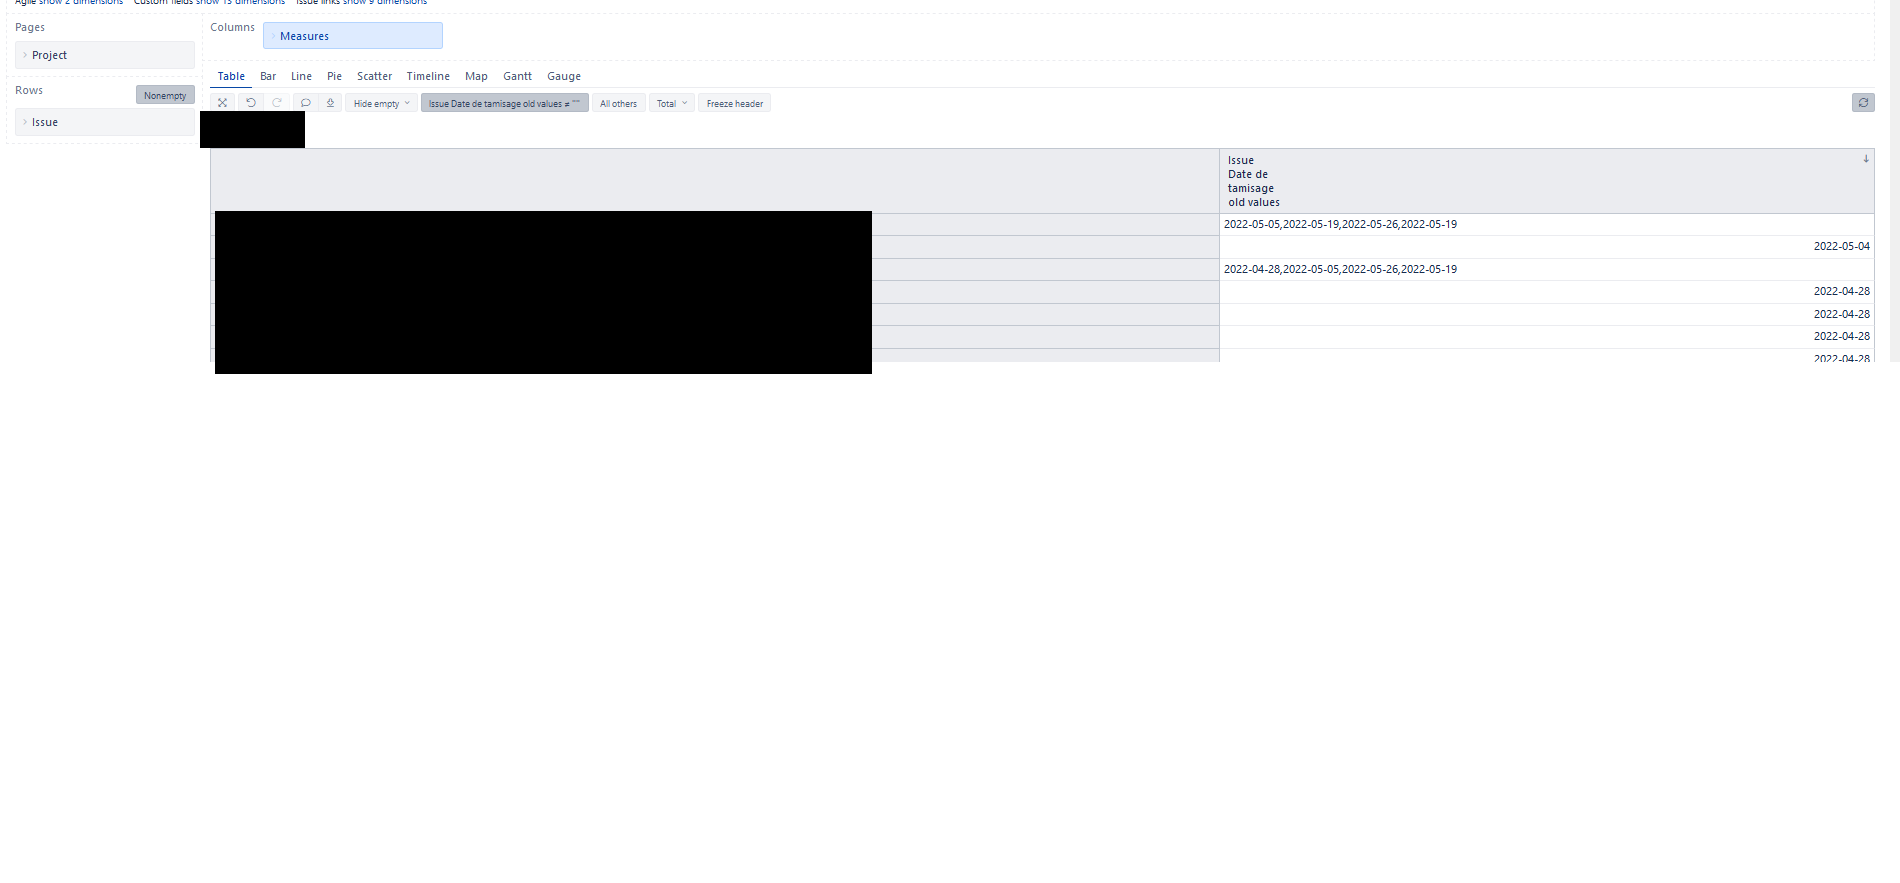
i can show the old value by chosing issue dimension in row and then chosing the measures in column.
this is the result :
i wonder if what the measure return is an array of Date or just a string
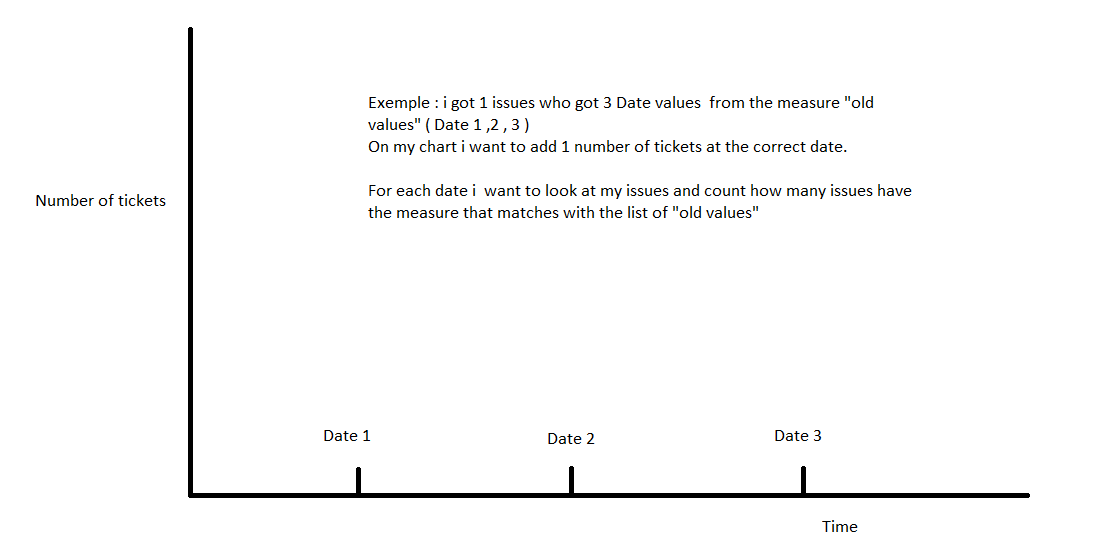
My final will is to have Time dimension in row and create a measure base on " Issue Target start old values" . Like my description below.
Hi @XavierH
The default issue property shows just what has been the previous dates for the particular date field.
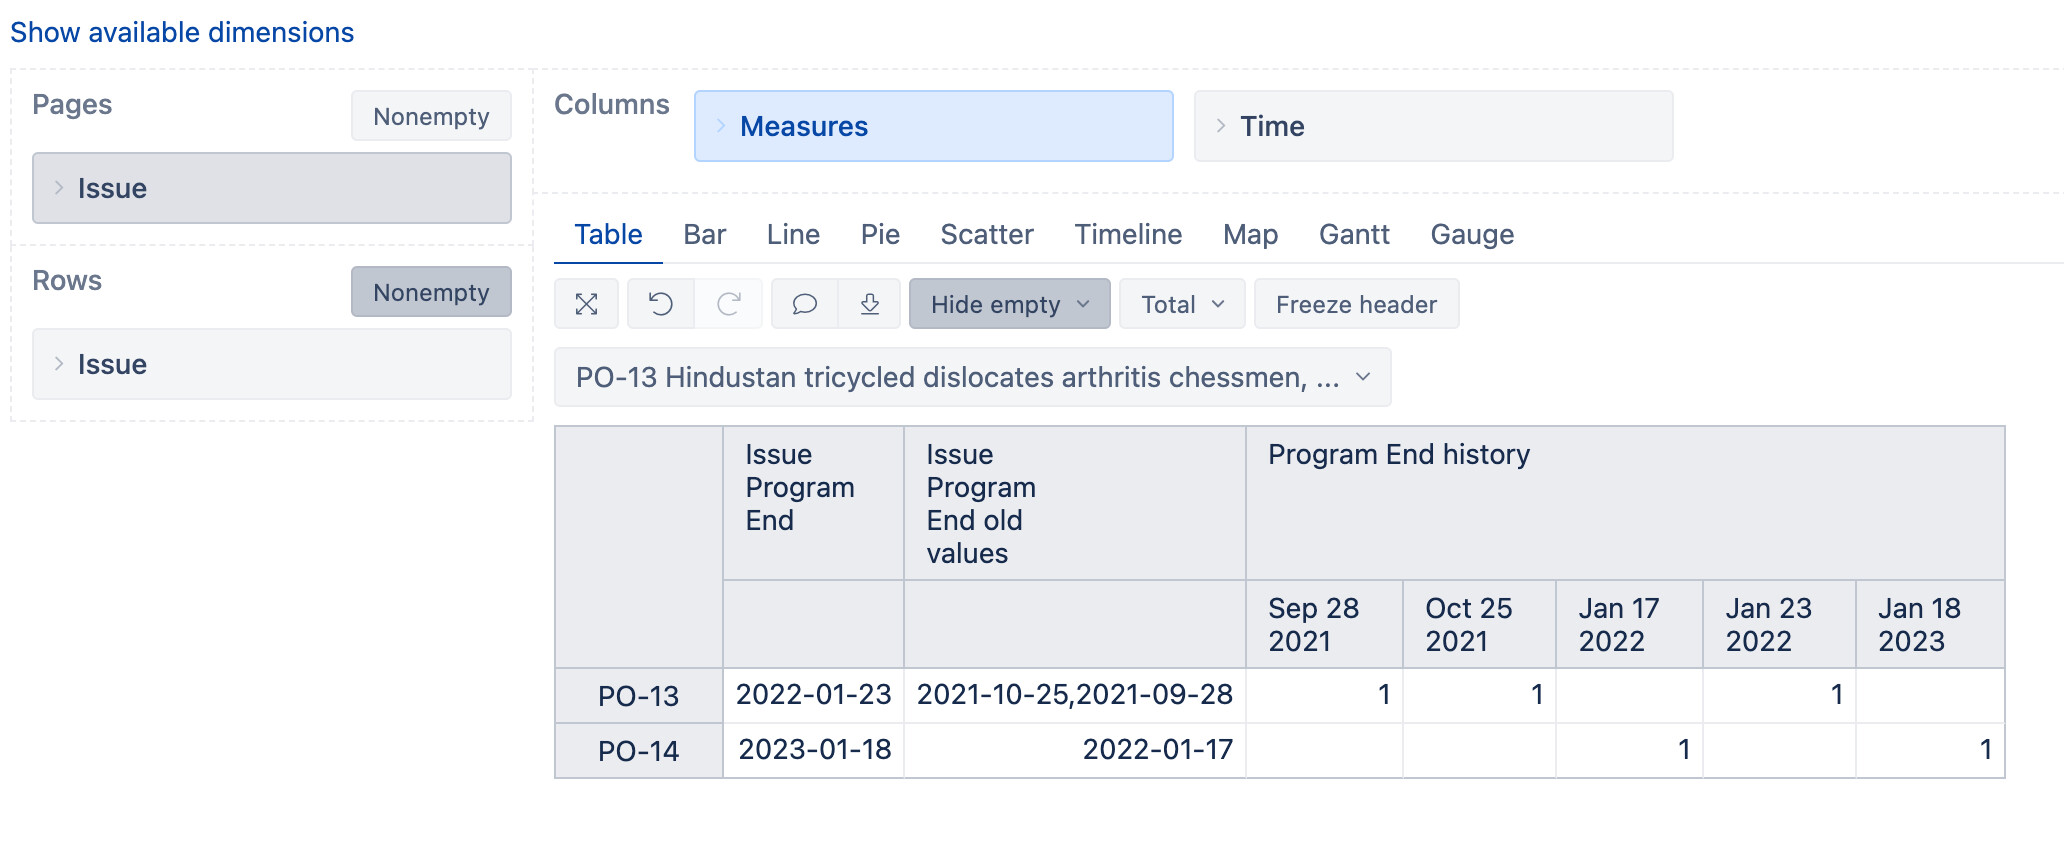
But if you would like to count how many issues have had a due date on a particular day, you can use Javascript in advanced settings to define (and then select for import) a new pre-calculated field “Date picker history”. Then, using the “Time” dimension, the measure would return 1 for all the previous date picker values.
Below is the script I used in my example with the custom date picker field “Program end”:
[jira.customfield_enddatehistory]
name = "Program End history"
data_type = "integer"
measure = true
multiple_dates = true
javascript_code = '''
var enddatehistory = new Array();
if (issue.changelog && issue.changelog.histories && issue.changelog.histories.length > 0) {
  var histories = issue.changelog.histories;
  for (var i = 0; i < histories.length; i++) {
    var history = histories[i];
    if (history.items && history.items.length > 0) {
      for (var n = 0; n < history.items.length; n++) {
      var item = history.items[n];
      if (item.field == 'Program End') {
        //value date + counter
        enddatehistory.push(item.to+ "," + 1);
        }
      }
    }
  }
};
if(enddatehistory)
{issue.fields.customfield_enddatehistory = enddatehistory.join("\n");}
'''
In the report:
best,
Gerda // support@eazyBI.com