I was asked a simple question: “I want a report on who closed the most issues, my service desk team, the end customer, automation OR a user that isn’t a reporter or assignee”.
I then realised that this was incredibly difficult to generate. I was trying JQL but "was resolved by " only take a user.
Anyone been able to generate a similar report via eazy BI?
You can prepare a table report with Transition Author dimension in the rows, and then you can count the number of transitions to Completed (or whatever status) per the group of the transition author, as follows:
New measure: Transition Author Group is
[Reporter].[User].getmemberbykey(
cast([Transition Author].CurrentMember.key as String)).GetString(‘Groups’)
New measure: Transition to Done made by Transition Authors in the CEO Group
(replace Done and CEO with your specific status and group):
Sum(
Filter(
Descendants([Transition Author].CurrentHierarchyMember, [Transition Author].[User]),
instr([Measures].[Transition Author Group], 'CEO') >= 1
),
([Measures].[Transitions to status], [Transition Status].[Done])
)
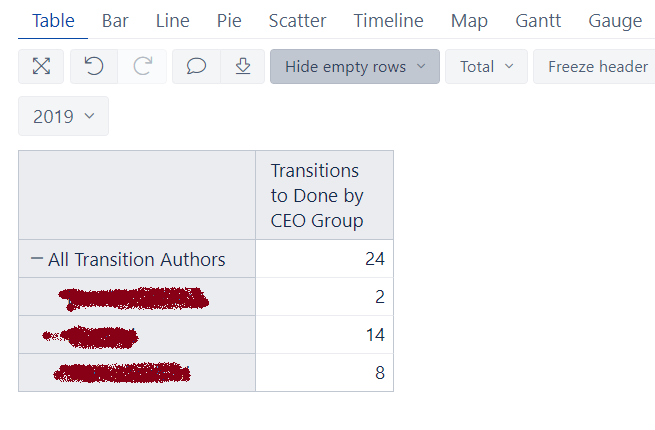
You can even put the time dimension in the pages and filter for specific period.
This solution is based on the fact that customers / service desk team belong to different user groups.
End result is something like that:
Hi @Colin_McDermott,
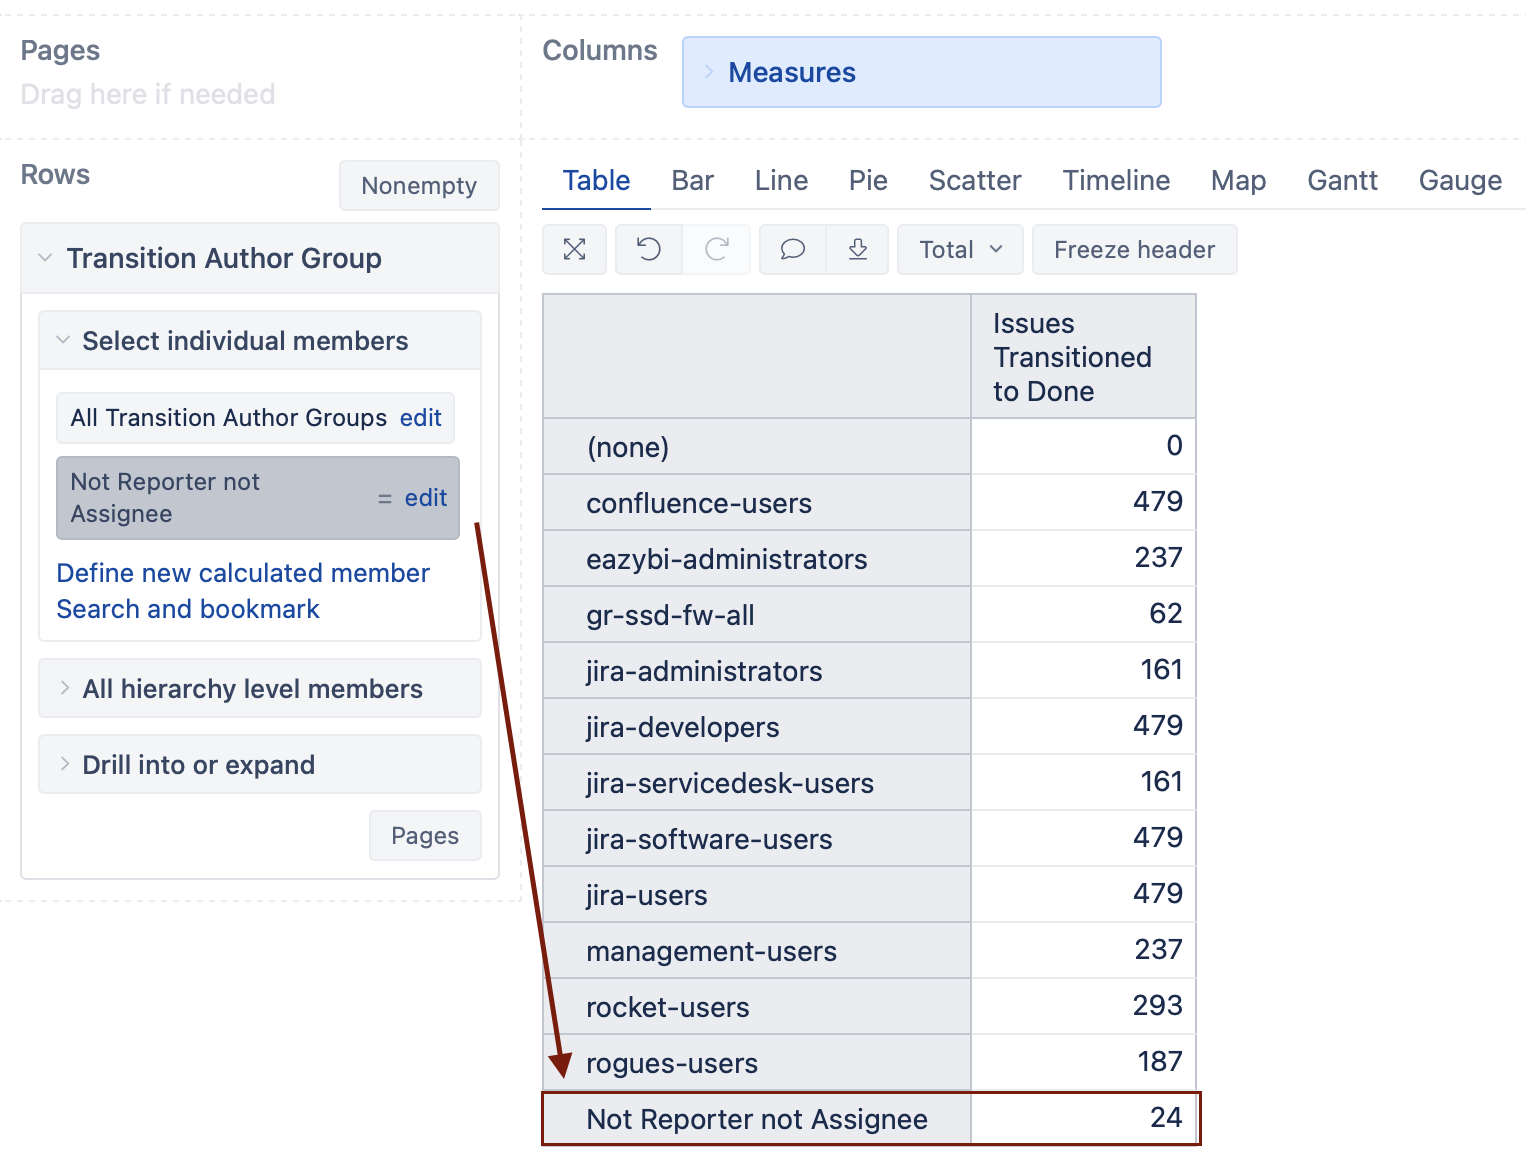
One approach I can think of is defining a “dummy” calculated member in the Transition Author group dimension and then defining a calculated measure. For the “dummy” calculated member, you can use the Transition Author group dimension default member. See an example below:
-- Not Reporter not Assignee
[Transition Author Group].DefaultMember
Then define a new calculated measure with the formula below:
CASE WHEN [Transition Author Group].CurrentMember <> [Transition Author Group].[Not Reporter not Assignee]
THEN
val(([Measures].[Transitions to status issues count],[Transition Status].[Done]))
ELSE
Sum(
  Filter(Descendants([Issue].CurrentMember,[Issue].[Issue]),
  -- Transition author is not the same user as the assignee
  IsEmpty((
    [Transition Author].[User].GetMemberByKey(
      [Issue].CurrentHierarchyMember.Get('Assignee name')
    ),[Measures].[Transitions to status],
    [Transition Status].[Done]
  ))
  AND
  -- Transition author is not the same user as the reporter
  IsEmpty((
    [Transition Author].[User].GetMemberByKey(
      [Issue].CurrentHierarchyMember.Get('Reporter name')
    ),[Measures].[Transitions to status],
    [Transition Status].[Done]
  ))
  ),([Measures].[Transitions to status issues count],[Transition Status].[Done])
)
END
With the Transition Author group dimension in rows and the “dummy” calculated member selected, the report could look similar to the one below:
See the eazyBI documentation page for more details on defining calculated measures and members - https://docs.eazybi.com/eazybijira/analyze-and-visualize/calculated-measures-and-members.
Best,
Roberts // support@eazybi.com