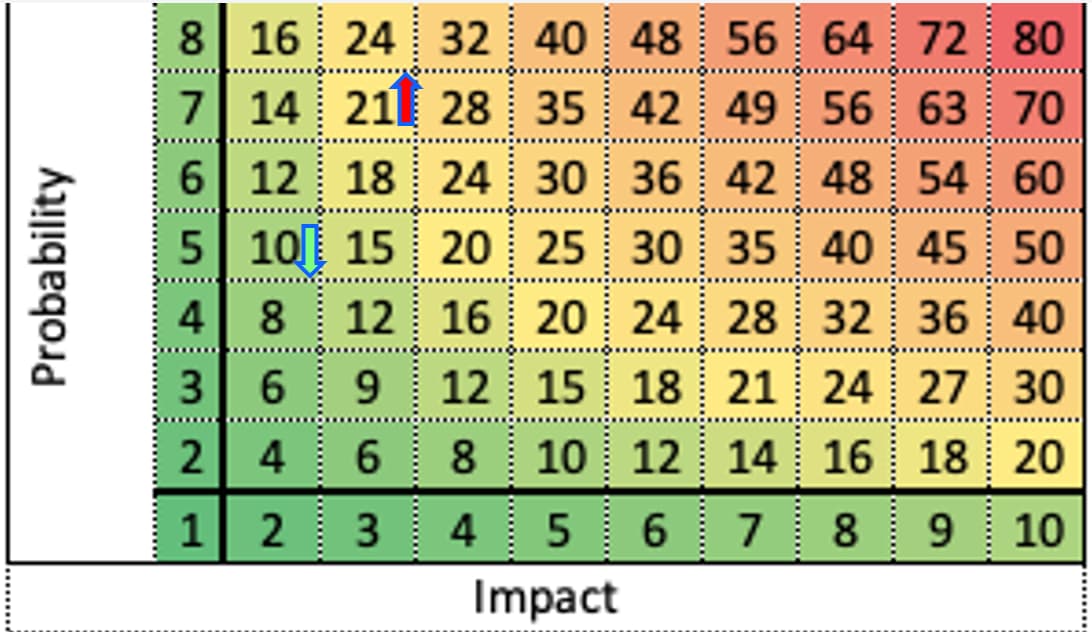
What does this arrow represent exactly? Is that some change vs the previous value?
How would you set rules for arrows to appear green or red in the chart?
For example, why would 21 value has red upwards arrow and 10 value green downwards arrow?
Martins / eazyBI