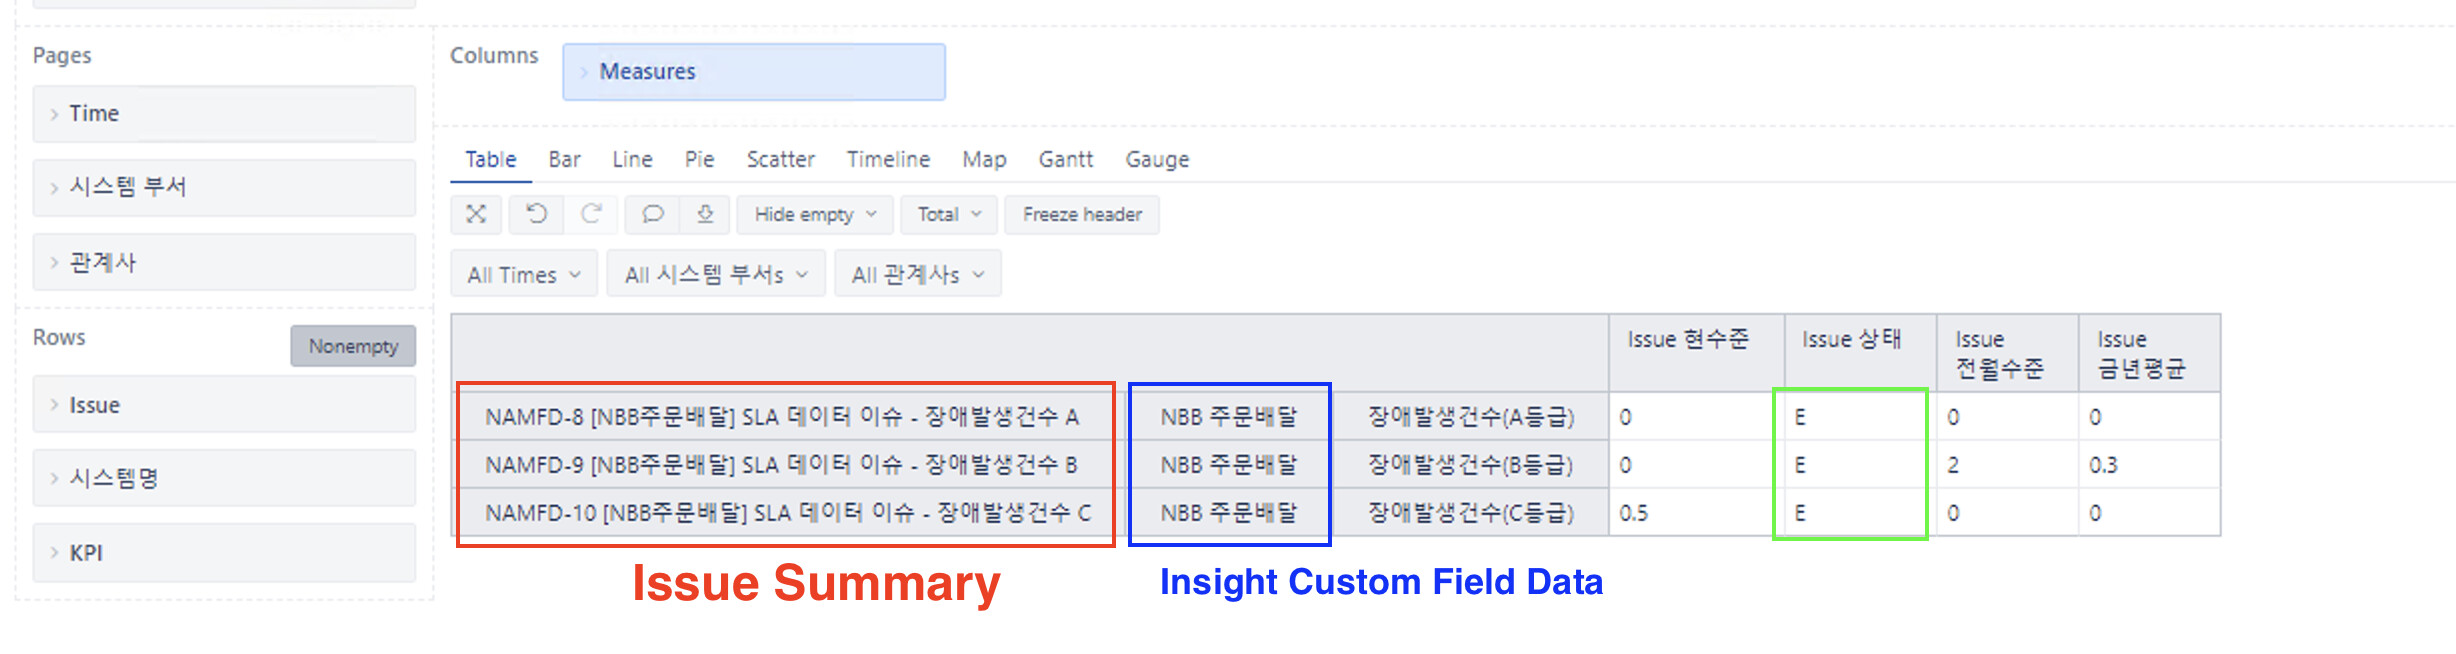
I would like to hide the summary of the issues (Red box). Additionally, I would like to merge rows with the same data in Custom field. (In the image, a blue box and if possible, green box)
Is there any way possible? I’d appreciate it if anyone could help me.
Thanks.
You may change the dimension order on rows to change the look of the report and merge values by Insight custom field data. In eazyBI rows are merged for the left side dimensions (columns) when the values are the same.
Feature request to allow more options for merging report cells is already on the eazyBI backlog. I can not give any estimates of when this feature will be developed, but I will post an update in this community post.
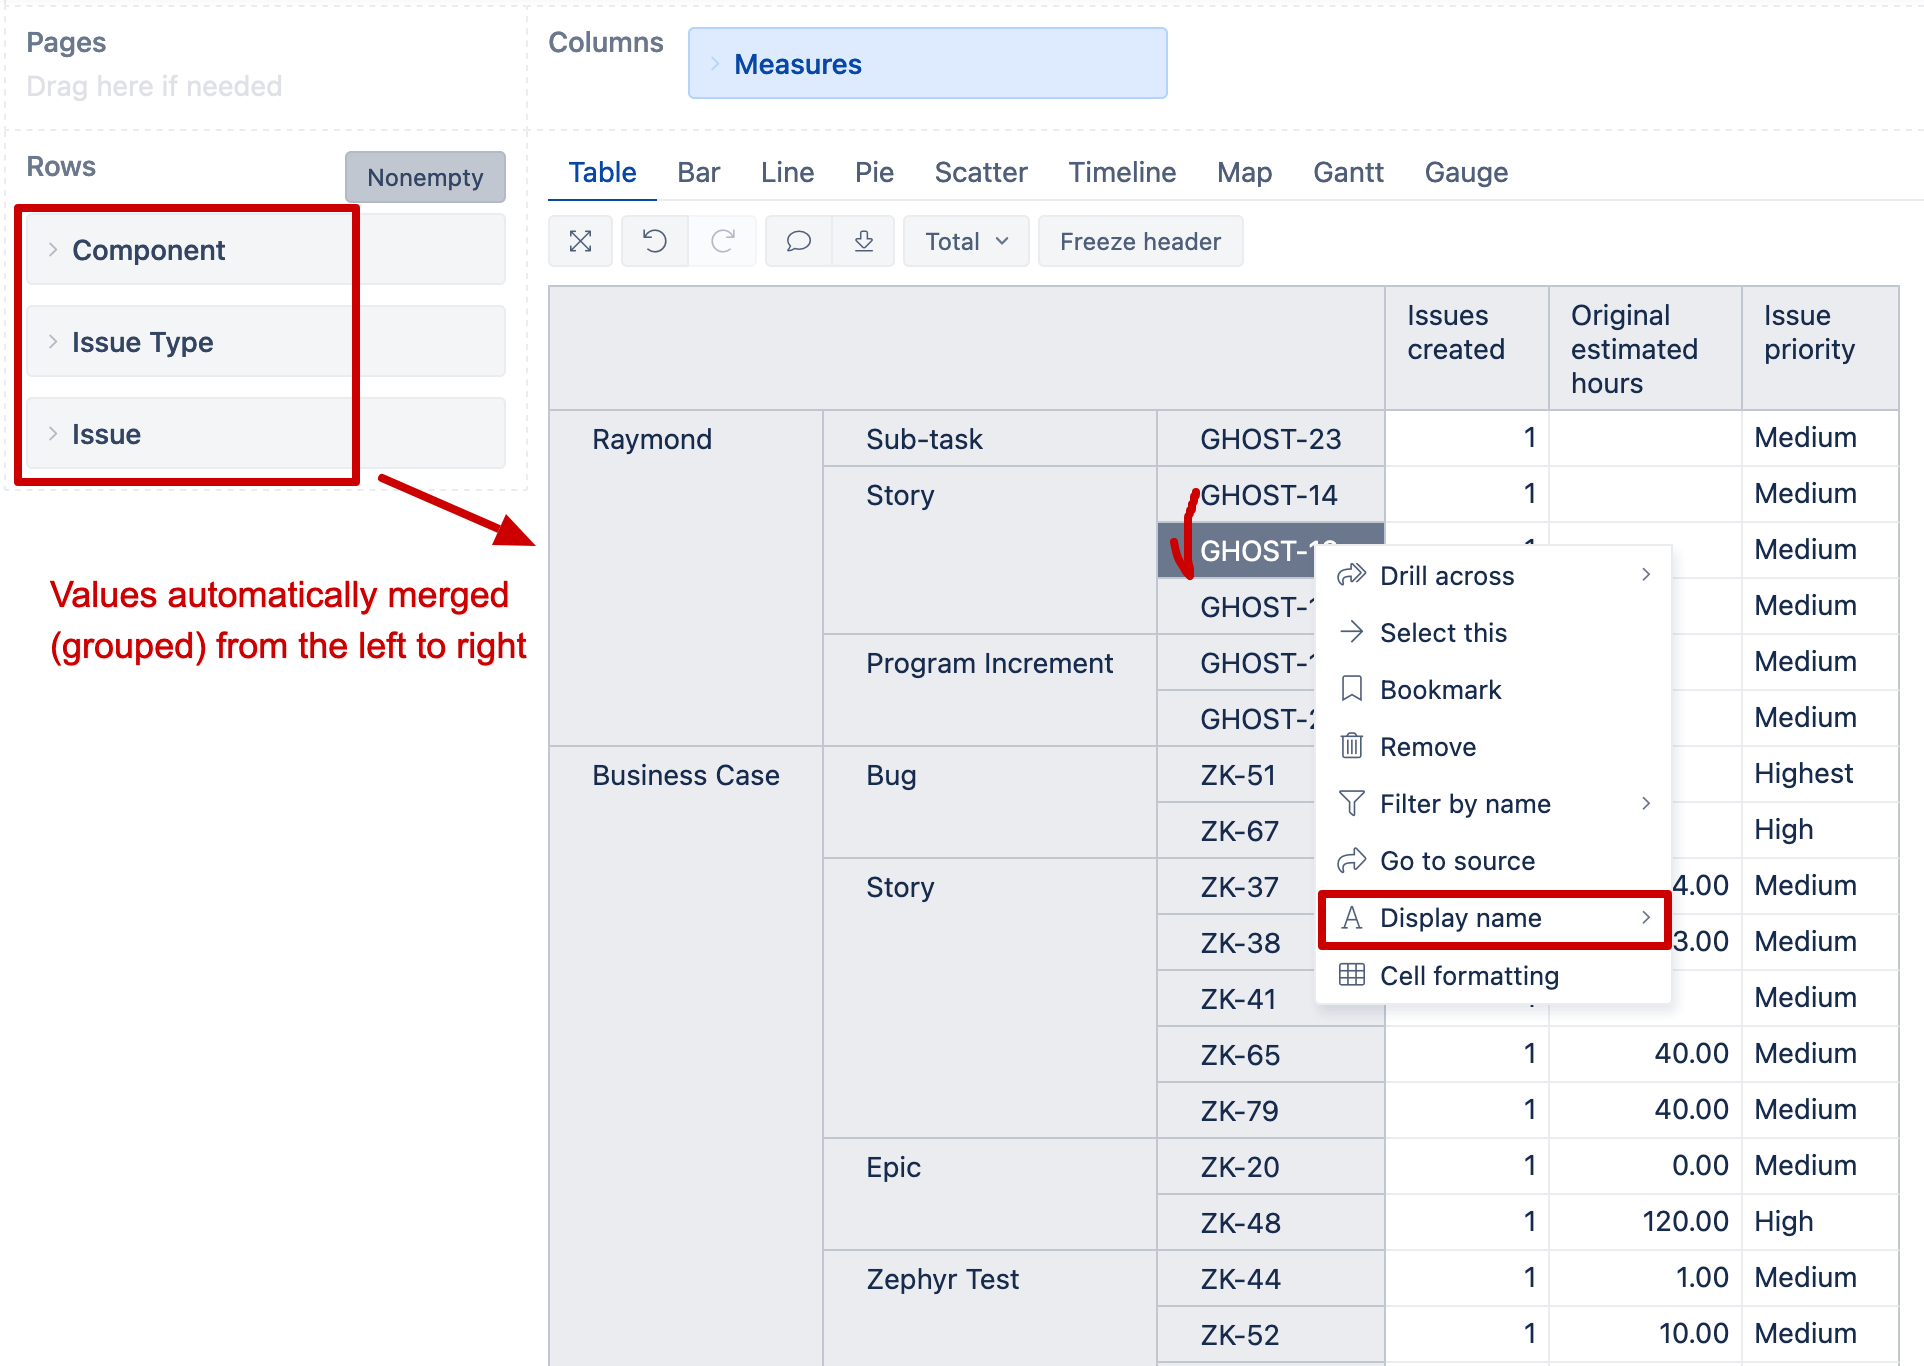
In the report, you may show only the issue key without the Summary. Click on any row with the issue name and select Display name >> Show key.
Thanks to your help, all the things I’m curious about have been solved.
But, Is there any way to just hide “row” itself instead of displaying the issue key without a summary?
And I have one more question.
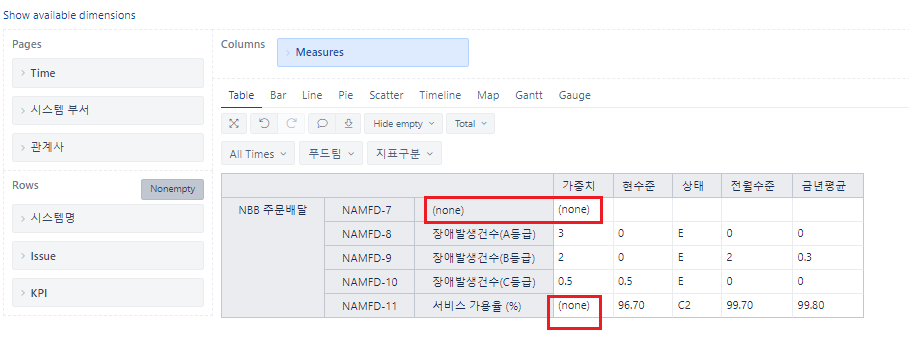
Fields with no values, as shown in the image below, are displayed with “(none)”. Is there a way to display it blank instead of “(none)”?
You may Remove particular rows from the report by clicking on them and selecting the option Remove. Or you may set the “KPI” dimension on pages and filter only values of interest.
Here is documentation describing how to set a dimension on pages and rows simultaneously: Create reports - Page dimensions.
If an issue does not have any value for the text type field (for example, single select field), those issues are grouped under the (none) value to allow you to filter by it. Therefore issue property also shows the value (none). If you want to show them as empty cells, there are two options.
You may add conditional cell formatting → Exact value for the column and set the text and background color to white if the value is (none). However, this approach does not clear the value; it just makes the visual illusion the cell is empty.
Here is documentation with more details: Conditional cell formatting
Another option is to create a new calculated measure in Measures and write the condition to show property value only when there is some valid value, NOT (none). For example, the expression might look like this:
CASE WHEN [Measures].[Issue xxxx] <> "(none)"
THEN [Measures].[Issue xxxx]
END
Here is documentation on calculated measures and condition expression CASE WHEN: Calculated measures
@zane.baranovska , Thanks for your reply!
The first method you mentioned was very helpful. But there is a question that I misunderstood and explained.
I want to know how to hide “columns” instead of all “rows”.
I want to hide only the columns that are displayed by “Issue Key” as shown in the previous attached image. The data remain, and I want to hide only the red box “Issue Summary” in first attached image.
Thanks.
All dimensions added to report rows and columns are present in the report so users would see all the information building up the report. You can not hide the column (dimension) if you have added it to the report.
The Undo button works as long as you have the report open (see documentation create report - customize table).
If you have removed some column and saved report, you can still use the undo button to get that column back. Then save the changes again.
Once you have closed the report, then there is no way to revert changes. The only option is to edit the report and recreate as it was; for example, find the removed measures and select it for the reprot again. Then save the changes.