I got the proper data after performing all the calculation.
I wish to visualize that report in a abstract way.
That we should only get a brief view.
Only the necessary information.
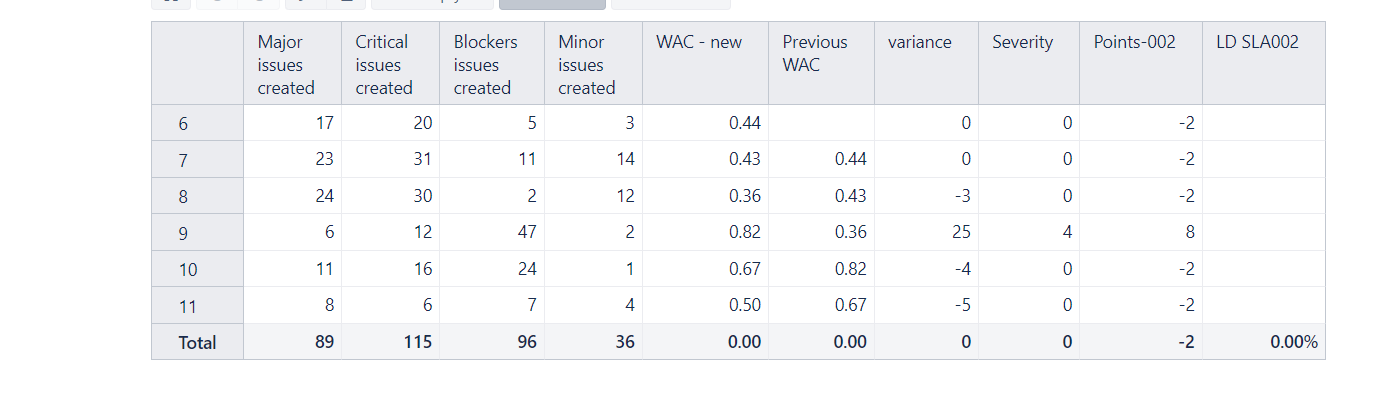
This is my final report -
My View should be like:
Total points = -2
LD% = 0
In a tabular format.
Hi @Sambhav,
As per our direct conversation - the ultimate requirement was to display only the Total values for two measures as figures and hide all intermediate calculations.
That is possible by applying the Gauge chart Value eonly option. Please read more about Gauge charts here - Create charts.
However, you first need to define a measure that performs the calculations over the displayed categories.
The exact expression depends on the actual requirements and required calculation logic. You might share your actual calculations by exporting your report definition -
Export and import report definitions.
However, please also share the actual requirements and your setup to see the options for performance improvements.
Regards,
Oskars / support@eazyBI.com