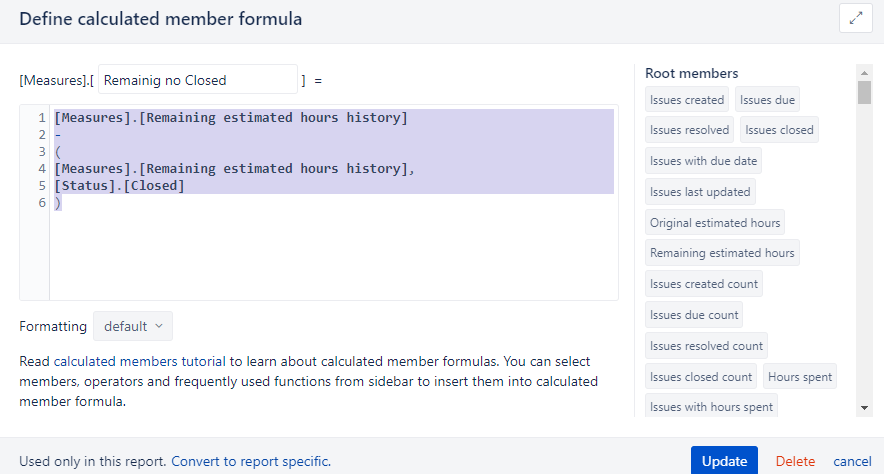
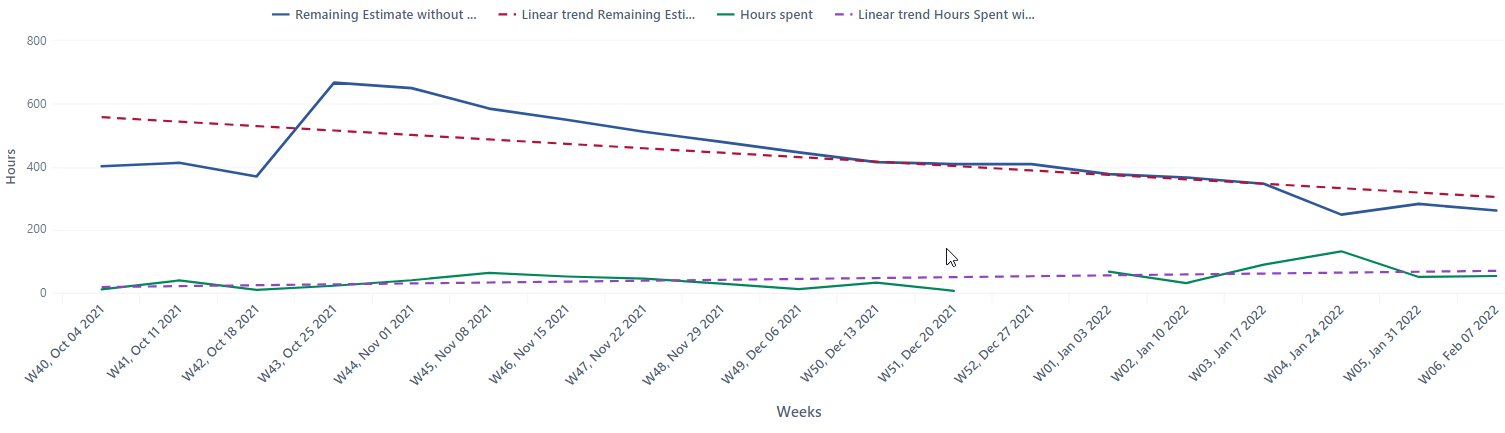
I what to create a chart with one line for Time Remaining (without closed status included) and 1 one with the Actuals (with closed status included) then I will add the Time Remaining with a tending forecast. This way I do not have to put status in the page an impact both lines.
[Measures].[Remaining estimated hours history] but need to omit any thing in a status of “Closed” or “Resolved”
[Measures].[Remaining estimated hours history]
Cache(
NonZero(Sum(PreviousPeriods([Time].CurrentHierarchyMember),
[Measures].[Remaining estimated hours change]
))
)
This gives me everything but tried several options to remove the status of closed and resolved but seams to be ignored. Any suggests greatly apricated.
FTGraham