Hi,
Is there someone or somewhere where I can find how to make a user management report?
It’s about creating a report about user and group management in Jira.
The solution will probably be to import the data with API:
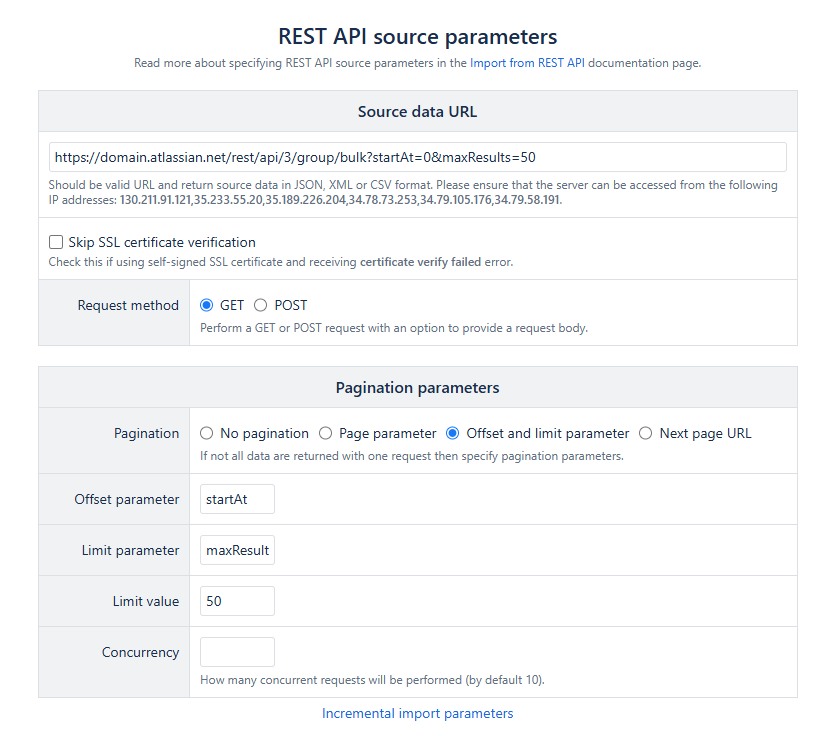
Following up with JavaScript that would each group extract the users:
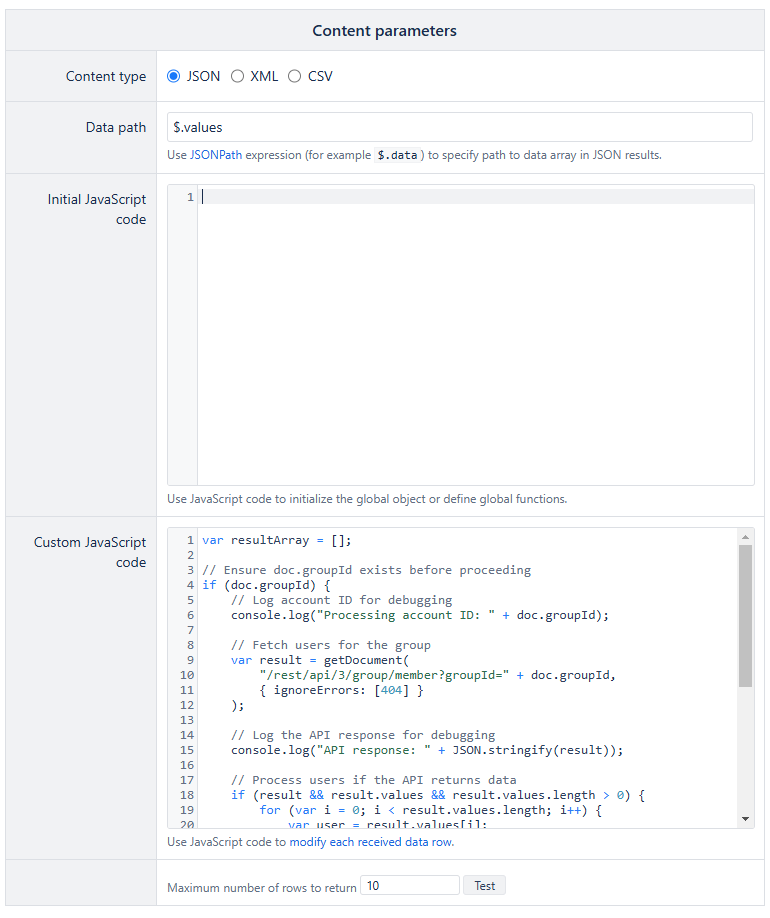
JavaScript:
var resultArray = [];

// Ensure doc.groupId exists before proceeding
if (doc.groupId) {
    // Log account ID for debugging
    console.log("Processing account ID: " + doc.groupId);

    // Fetch users for the group
    var result = getDocument(
        "/rest/api/3/group/member?groupId=" + doc.groupId,
        { ignoreErrors: [404] }
    );

    // Log the API response for debugging
    console.log("API response: " + JSON.stringify(result));

    // Process users if the API returns data
    if (result && result.values && result.values.length > 0) {
        for (var i = 0; i < result.values.length; i++) {
            var user = result.values[i];
            console.log("Processing user: " + JSON.stringify(user));
            if (user && user.emailAddress) {
                resultArray.push({
                    groupName: doc.name || "Unknown",
                    userEmail: user.emailAddress
                });
            }
        }
    }
} else {
    console.log("Skipping document without groupId.");
}

// Return the structured array
data = resultArray;
return data;
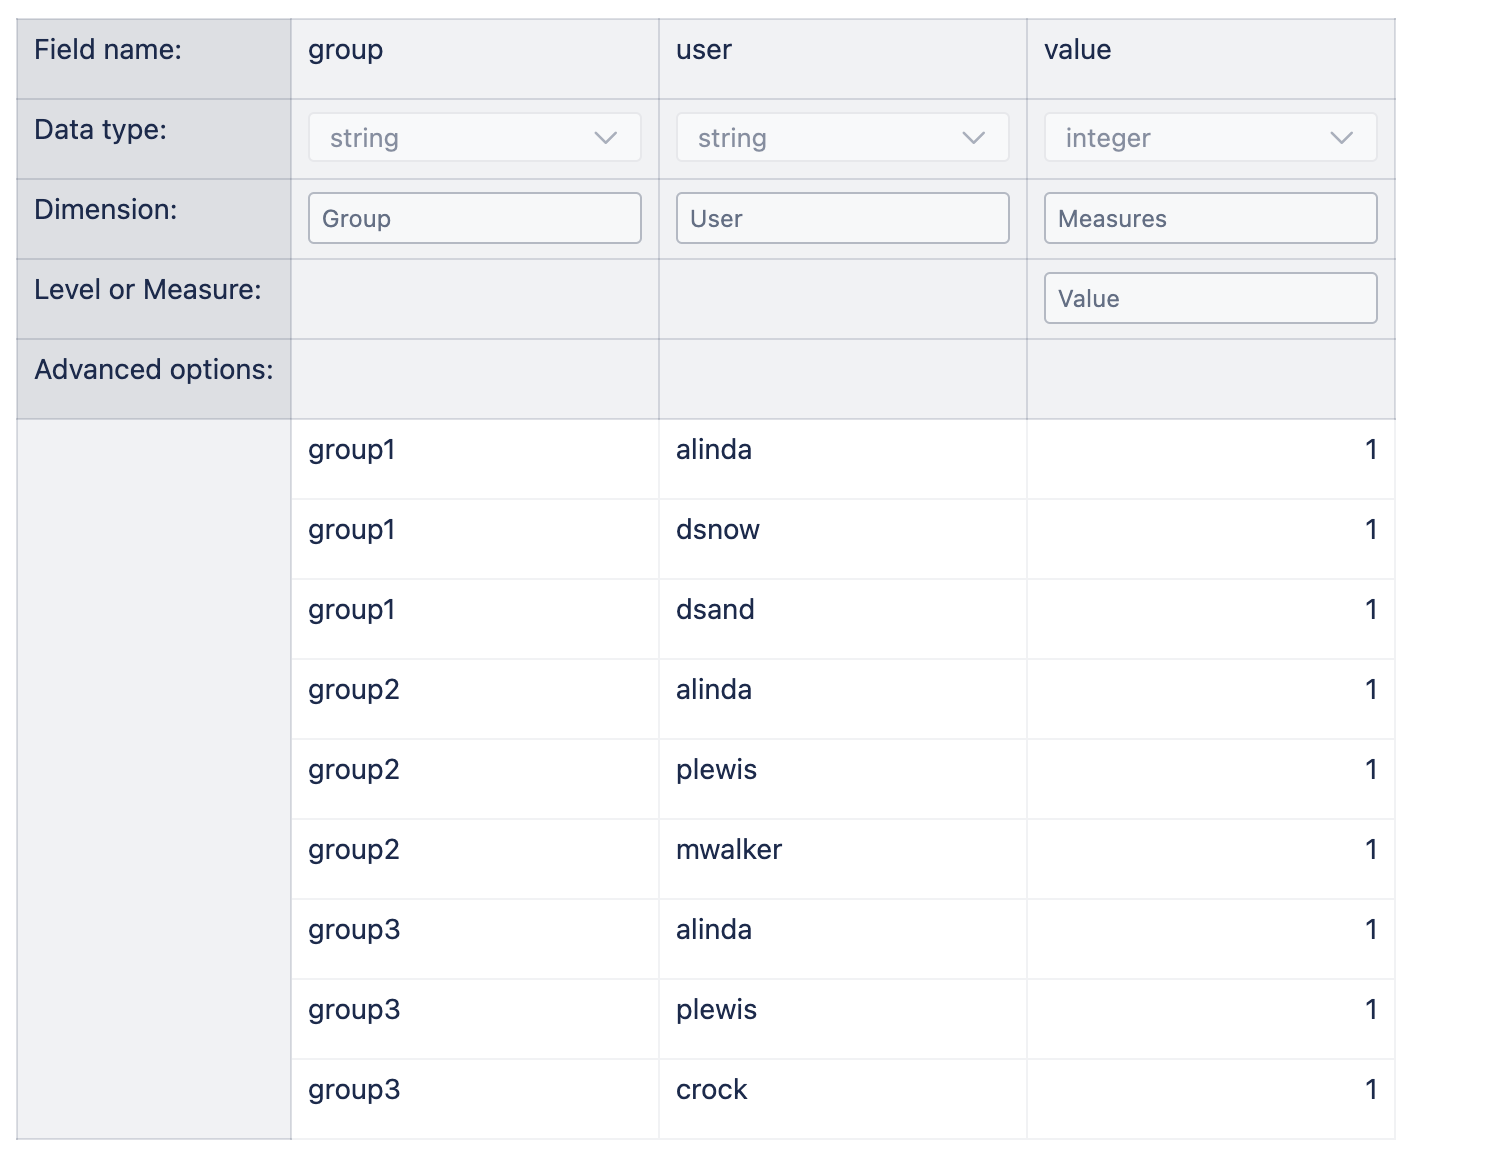
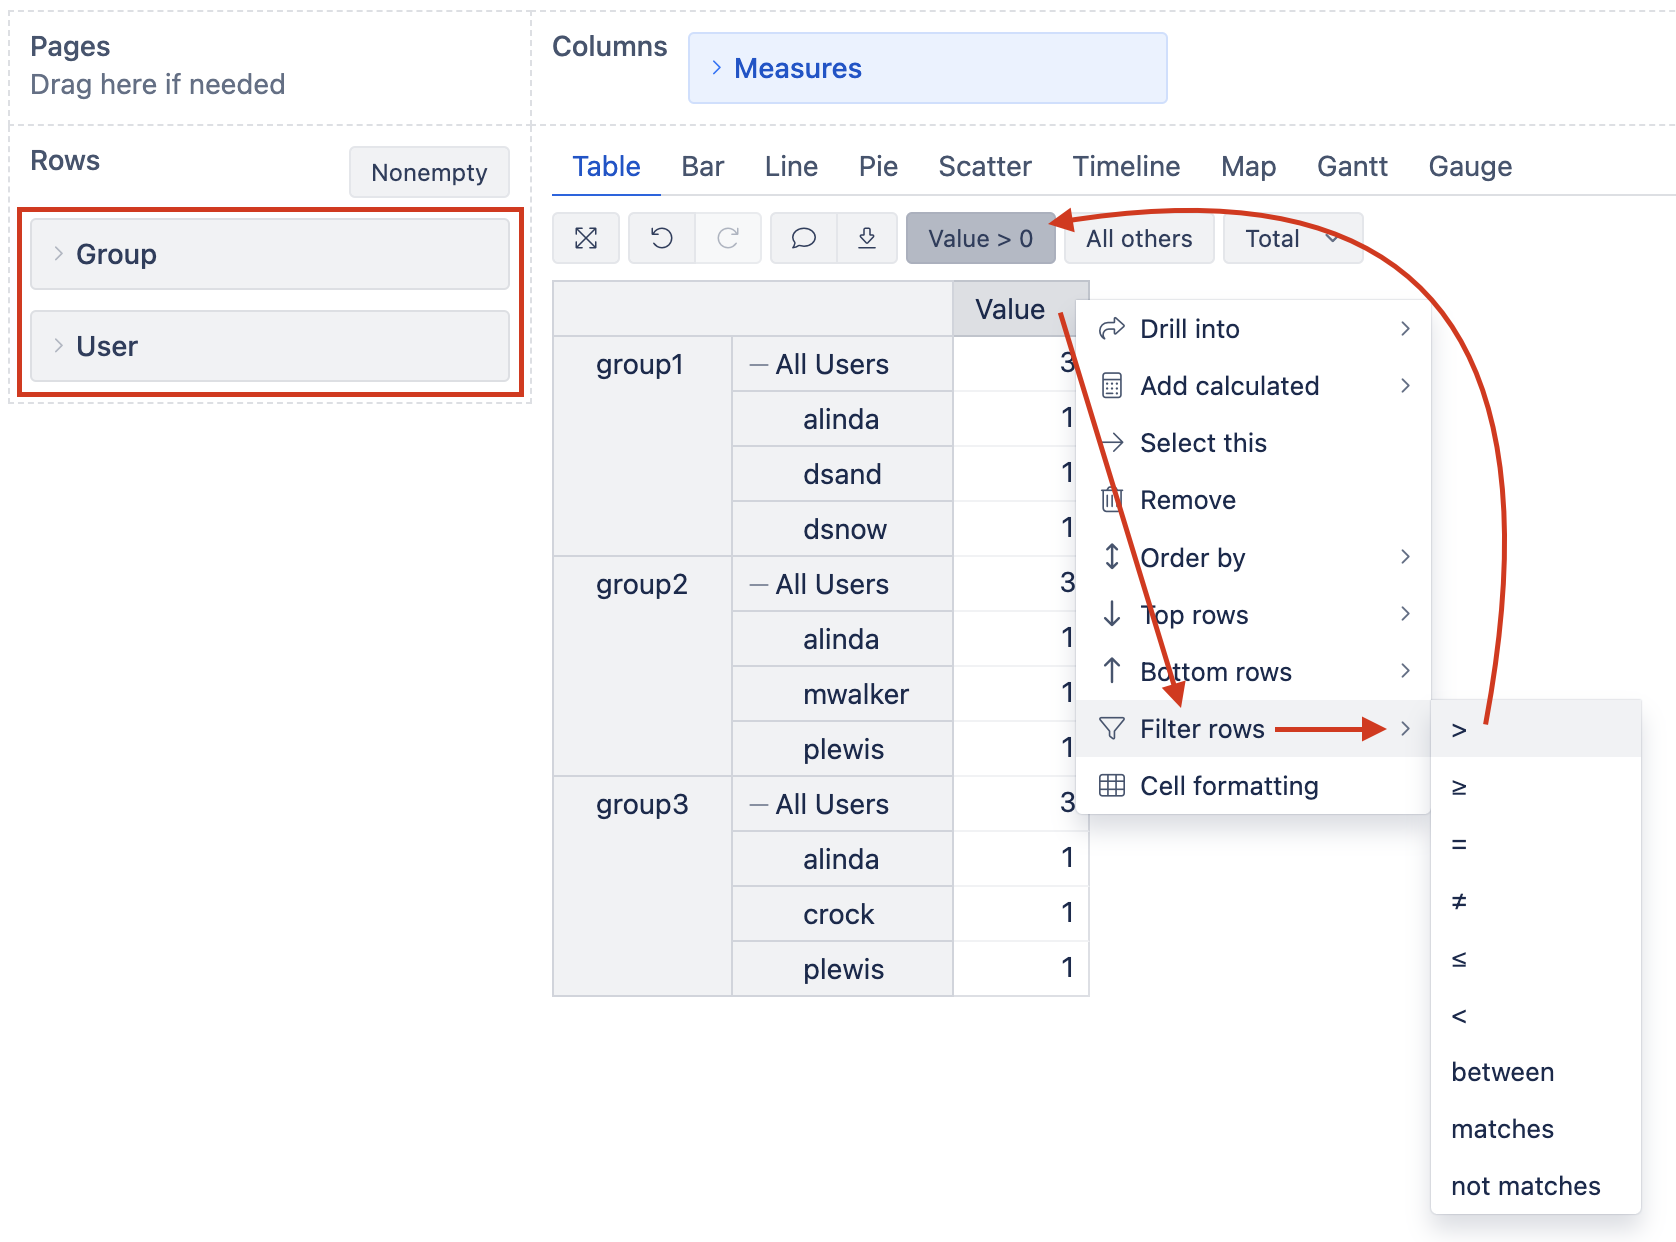
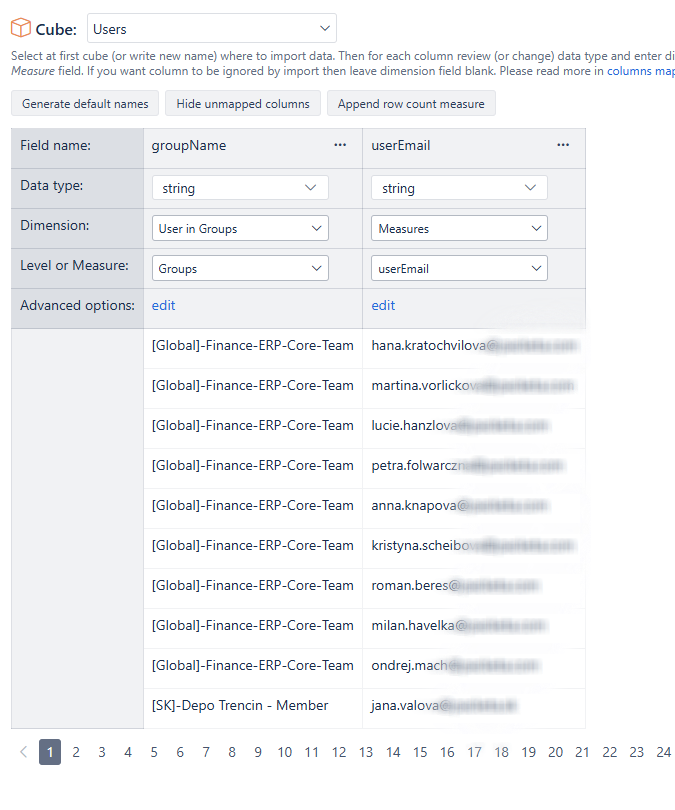
The problem lies here: I am still new and don’t know how I would make a dimension that would have a property that would show multiple users upon expanding the group.
I may be missing something. I would appreciate any help ![]()