I use EazyBI for Change management and I want to show something that I can’t work out.
As we have overlapping changes, I want to show how much time we spend doing changes per day.
So, we have Requested Window Start (RWS) and Requested Window End (RWE).
These are imported as Measure, Value and Property Changes, no option to import as a Dimension.
So effectively I think I need to add the number of minutes between RWS and RWE, then add these daily, to give the graph. But everything I seem to be able to do is using a count of how many issues have RWS/RWE set, rather than seeing the content of the field?
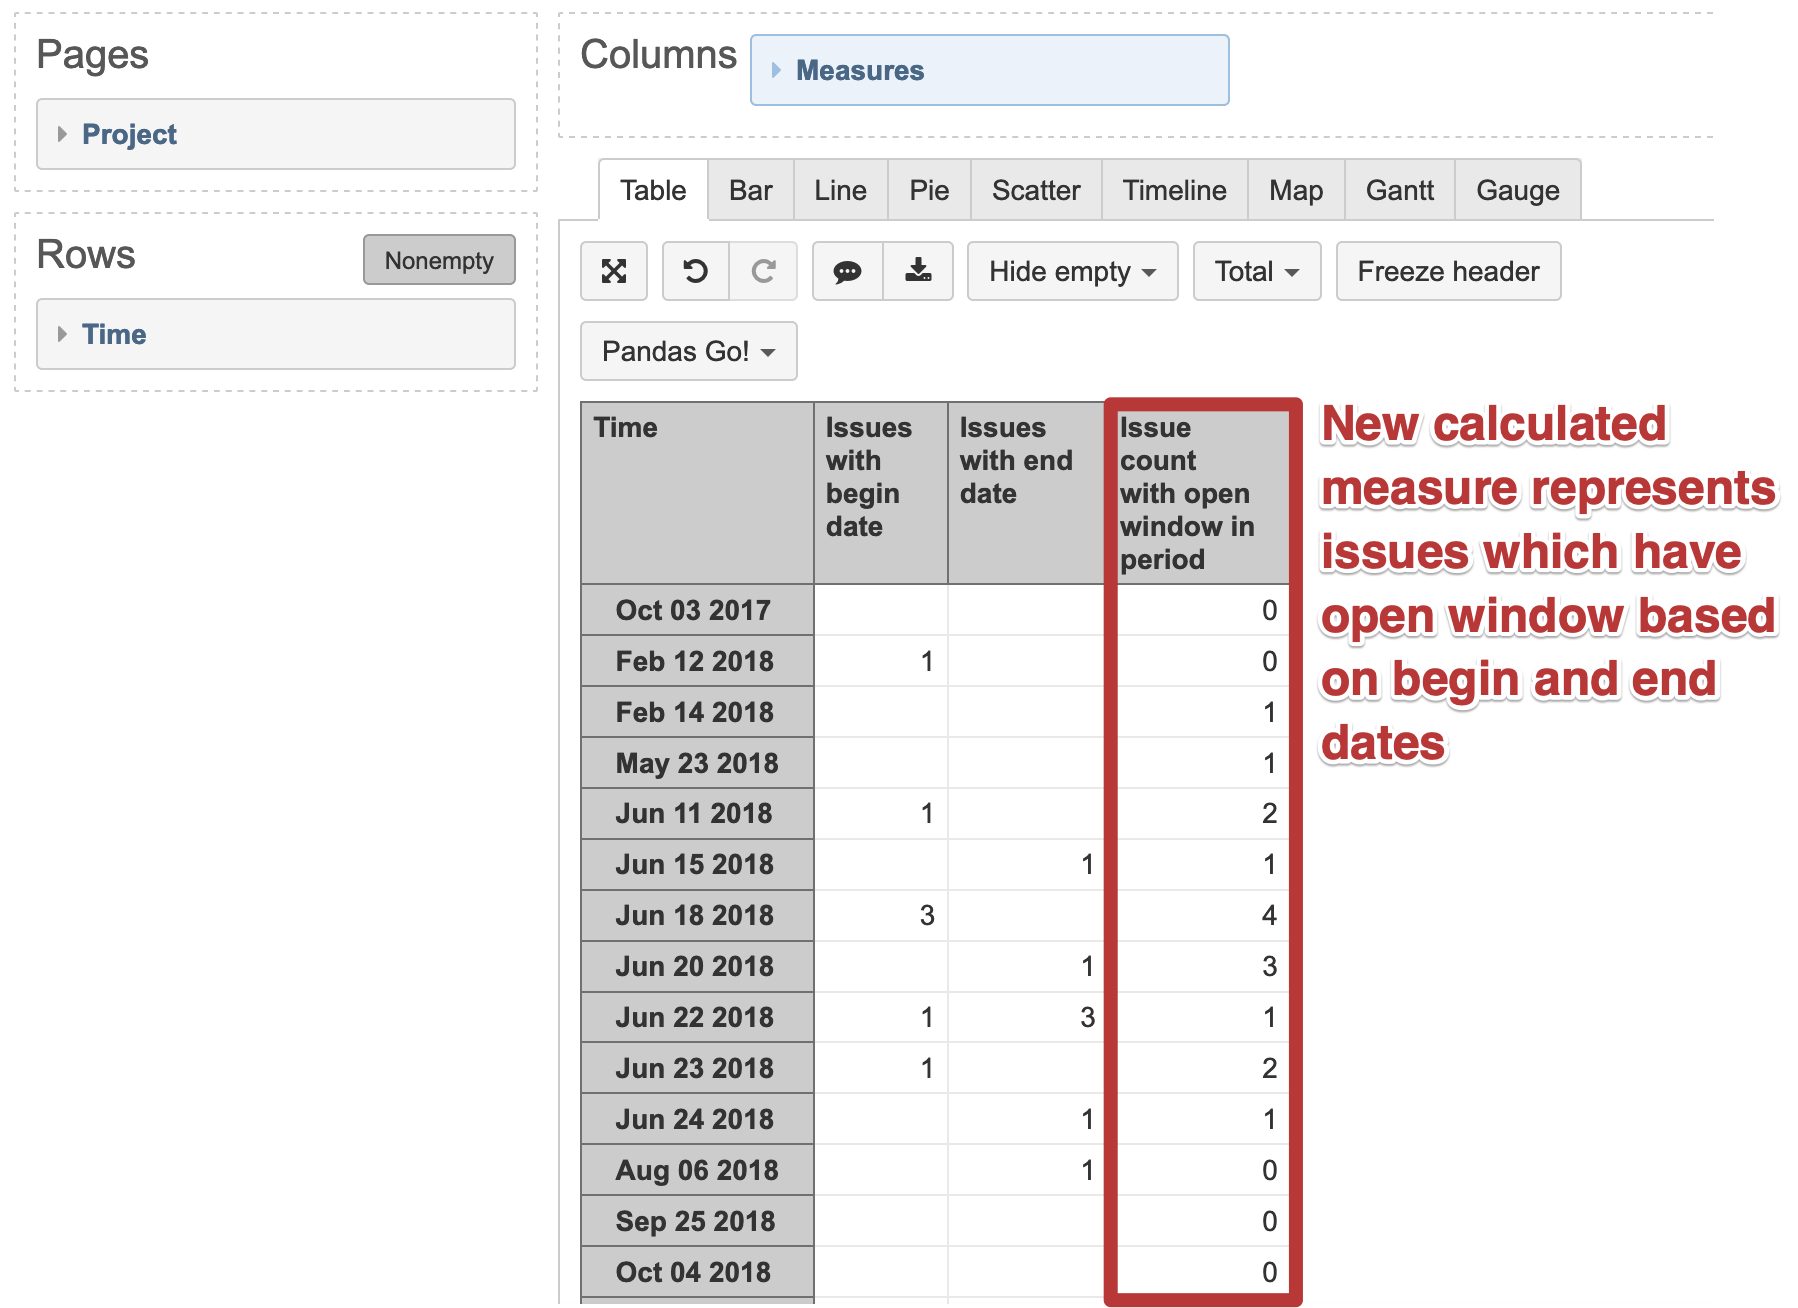
From the description, it looks like you would like to see how many issues have an open window (based on begin and end dates) and are overlapping at any day.
For this calculated measure, you may use any of the two following approaches.
Use function Count() and go through all issues with the begin and the end dates. For each issue validate those dates against the selected period. The formula might look like this:
Count(
  Filter(
    -- go through all issues
    Descendants([Issue].CurrentHierarchyMember,[Issue].[Issue]),
    -- with begin date in past or current period
    DateBeforePeriodEnd([Measures].[Issue Begin Date],
      [Time].CurrentHierarchyMember) AND
    -- with end date in current period or future
    DateAfterPeriodEnd([Measures].[Issue End Date],
      [Time].CurrentHierarchyMember) AND
    -- measure to add context of dimensions
    [Measures].[Issues history] > 0
))
Or build calculated measure similar to “Open issues”. Copy formula of “Open issues” and slightly modify it. Replace Issues create and creation date with measure representing start date. Replace Issues resolved and resolution date with measure representing end date.
The modified formula might look like this:
 CASE WHEN [Issue].CurrentMember.Level.Name <> 'Issue' THEN
   Cache(
     NonZero(Sum(PreviousPeriods([Time].CurrentHierarchyMember),
       Cache([Measures].[Issues with begin date]
           - [Measures].[Issues with end date])
     ))
     + [Measures].[Issues with begin date]
     - [Measures].[Issues with end date]
   )
 WHEN [Time].CurrentHierarchyMember IS [Time].CurrentHierarchy.DefaultMember
 THEN
   NonZero([Measures].[Issues with begin date]
          -[Measures].[Issues with end date])
 ELSE
   -- optimized formula for option Drill through Issues
   NonZero(IIF(
       DateBeforePeriodEnd(
         [Measures].[Issue Begin Date],
         [Time].CurrentHierarchyMember) AND
       NOT DateBeforePeriodEnd(
         [Measures].[Issue End Date],
         [Time].CurrentHierarchyMember),
     ([Time].CurrentHierarchy.DefaultMember,
       [Measures].[Issues with begin date]),
     0
   ))
 END
Thanks for all that - I’m afraid I must have described it somewhat badly because I think you’re answering something different to what I meant (equally I may be misunderstanding your response!).
Best way I can think of putting it:
In a day there are 24 hours
In a day there are X number of issues
Each of those issues has a RWS (date/time custom field) and RWE (ditto) (lets pretend we have 30 of these in a day, and they are all 1 hour each)
I want to be able to show the actual amount of time we spend doing these issues- ie the total time between RWE and RWS, added together for all issues per day/month
So using the example above, if that were the case every day, I would be able to say “for every 24 hours, we do 30 hours of changes”
edit: Yes I see where I worded it badly - the overlapping bit doesnt have anything to do with it other than the fact they overlap means there can be more than 24 hours worth of issues in every 24 hours, apologies
I will jump in your conversation with another suggestion - in the case you have now described you can use the DateDiffDays(…) function and sum the days from RWS date to RWE date. In the example below the issues would be grouped on Time by the RWS date:
Sum( -- Filter issues that have RWS date in the period
  Filter(Descendants([Issue].CurrentHierarchyMember, [Issue].[Issue]),
    DateInPeriod([Issue].CurrentHierarchyMember.get('RWS'),
      [Time].CurrentHierarchyMember) AND -- and when RWE date is not empty
    NOT IsEmpty([Issue].CurrentHierarchyMember.get('RWE')) AND -- and are created in the current report context
    ([Measures].[Issues with RWS],
     [Time].CurrentHierarchy.DefaultMember) > 0
  ),
      DateDiffDays(
        [Issue].CurrentMember.get('RWS'),
        [Issue].CurrentHierarchyMember.get('RWE'))
)
Please make sure that the naming of all measures and properties match your Jira/eazyBI setup.
Lauma / support@eazybi.com