How do I create a table that looks like that:
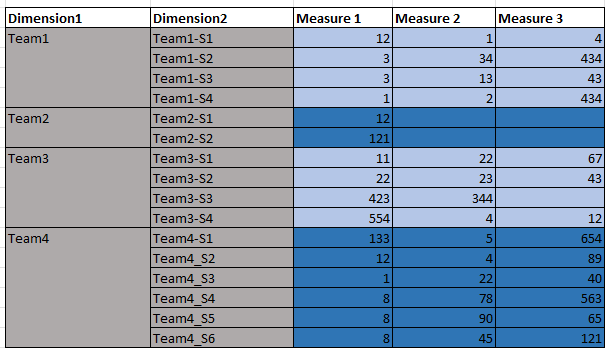
The number of Teams varies and unknown - I can not set the cell formatting or use the Markdown based on Team name.
The alternate colors are based only on the first dimension.
Help Please ![]()
How do I create a table that looks like that:
The number of Teams varies and unknown - I can not set the cell formatting or use the Markdown based on Team name.
The alternate colors are based only on the first dimension.
Help Please ![]()
Hi,
there are two options to achieve this result
Rank(
  CurrentTuple(VisibleRowsSet()).Item(0),
  Generate(
    VisibleRowsSet(),
    CurrentTuple(VisibleRowsSet()).Item(0)
  )
)
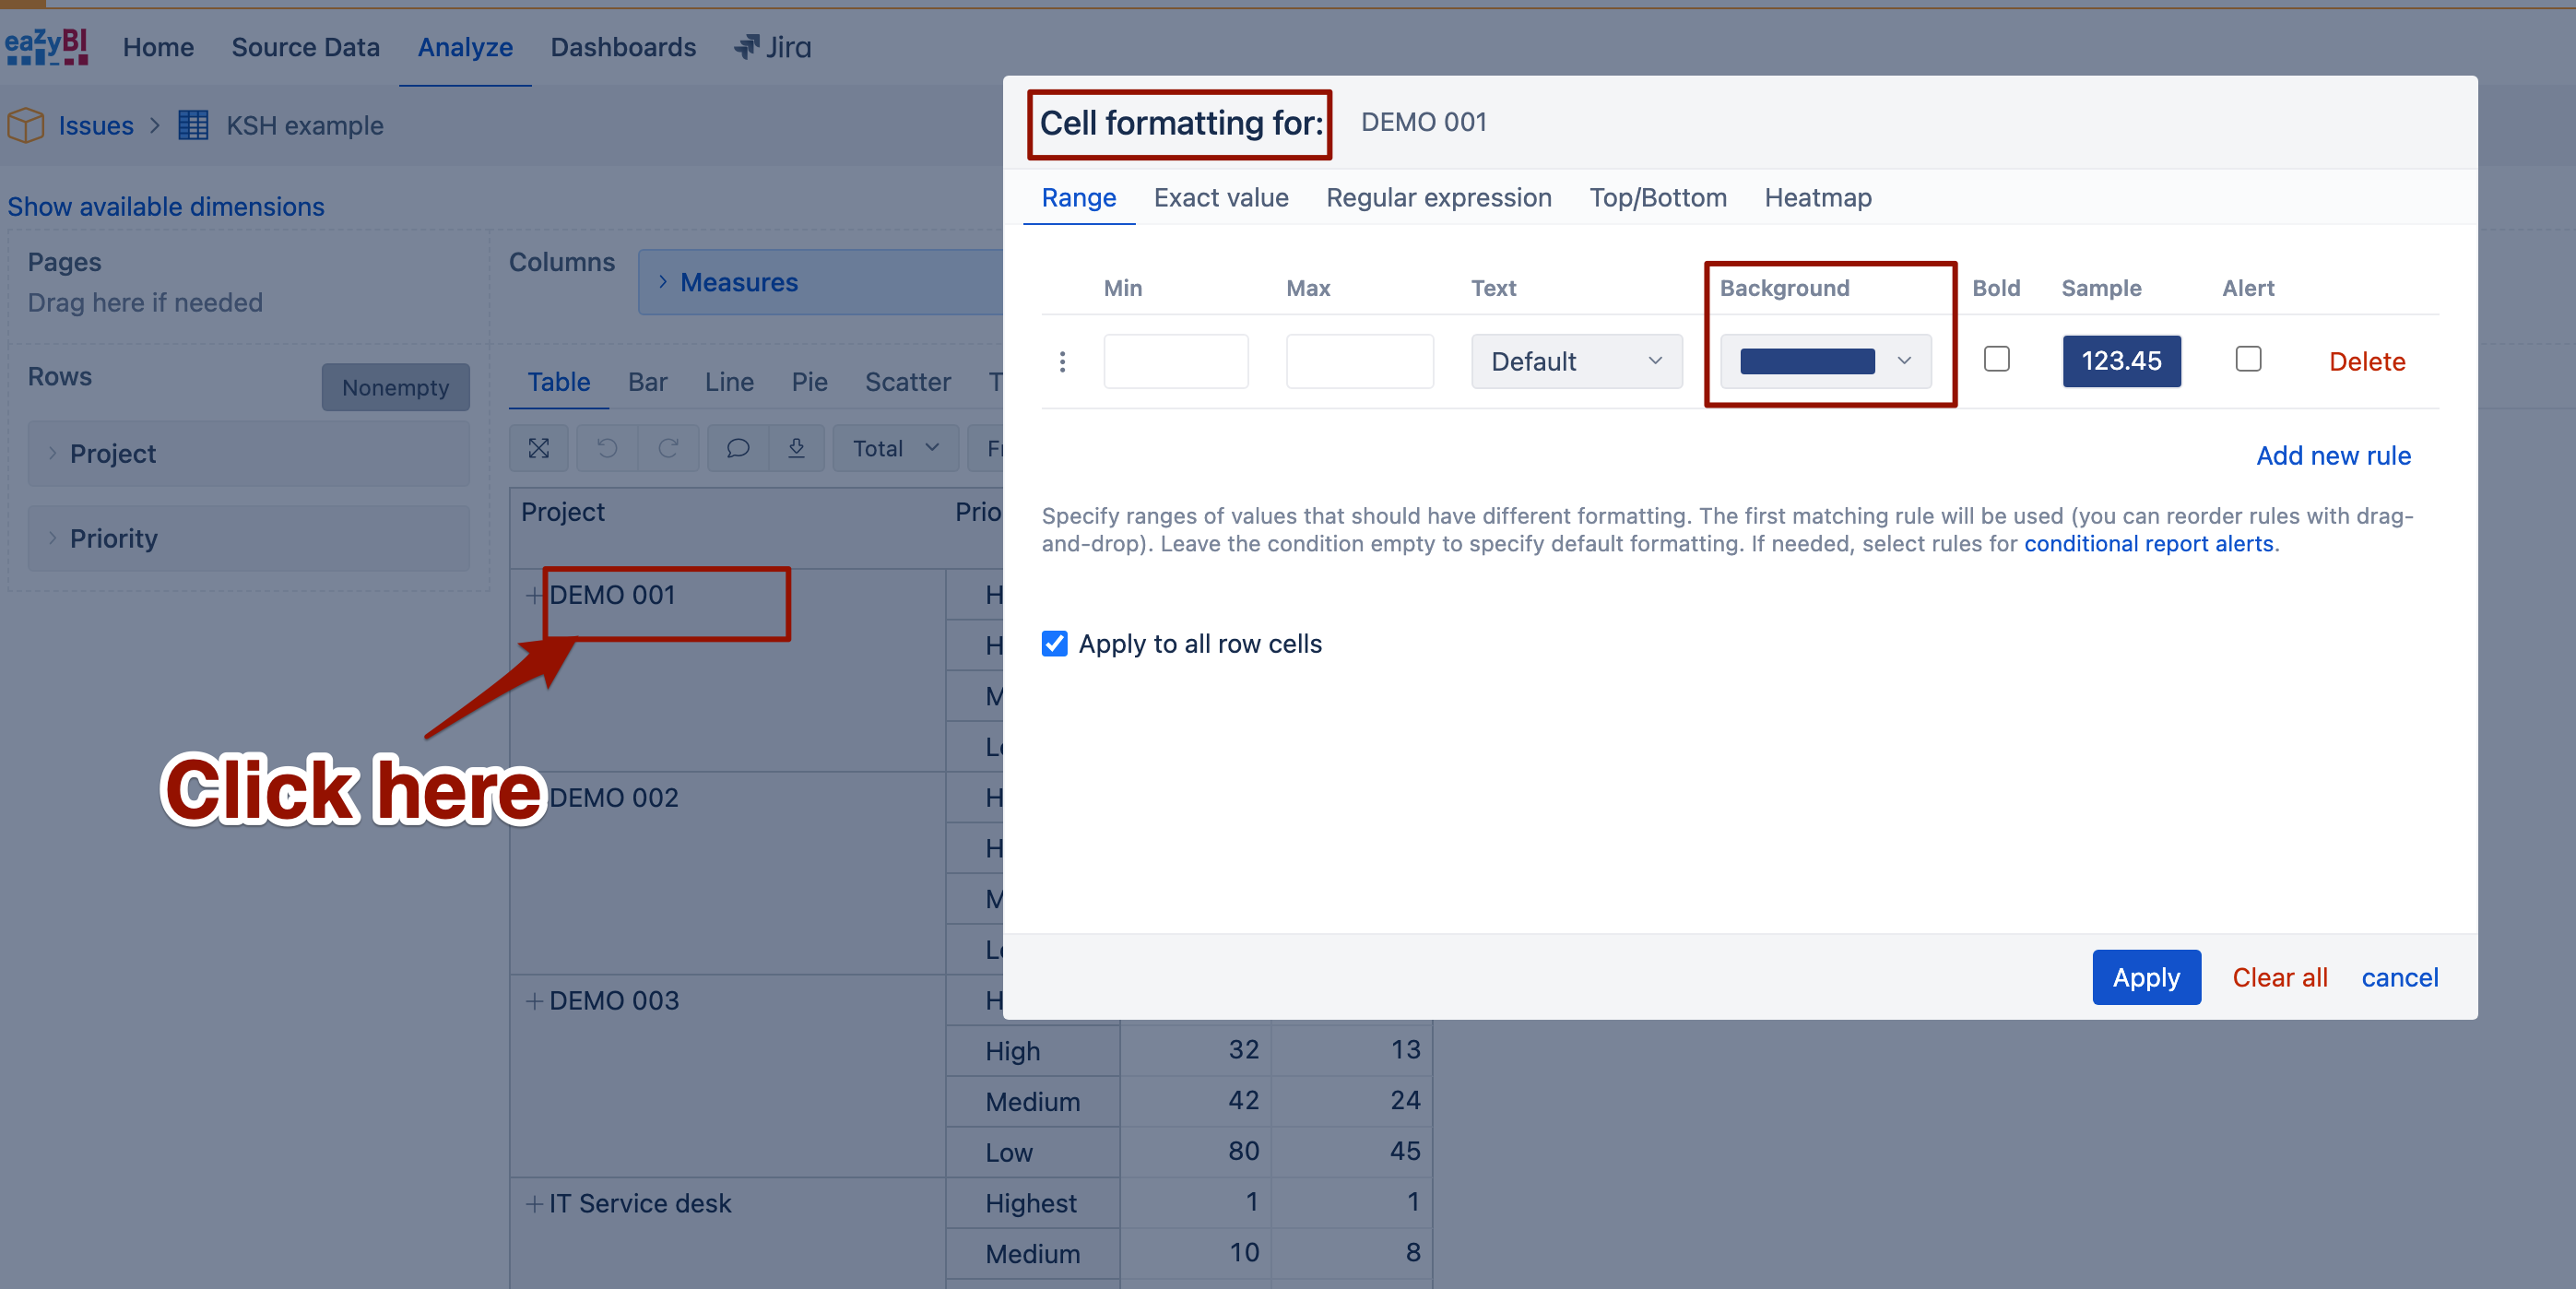
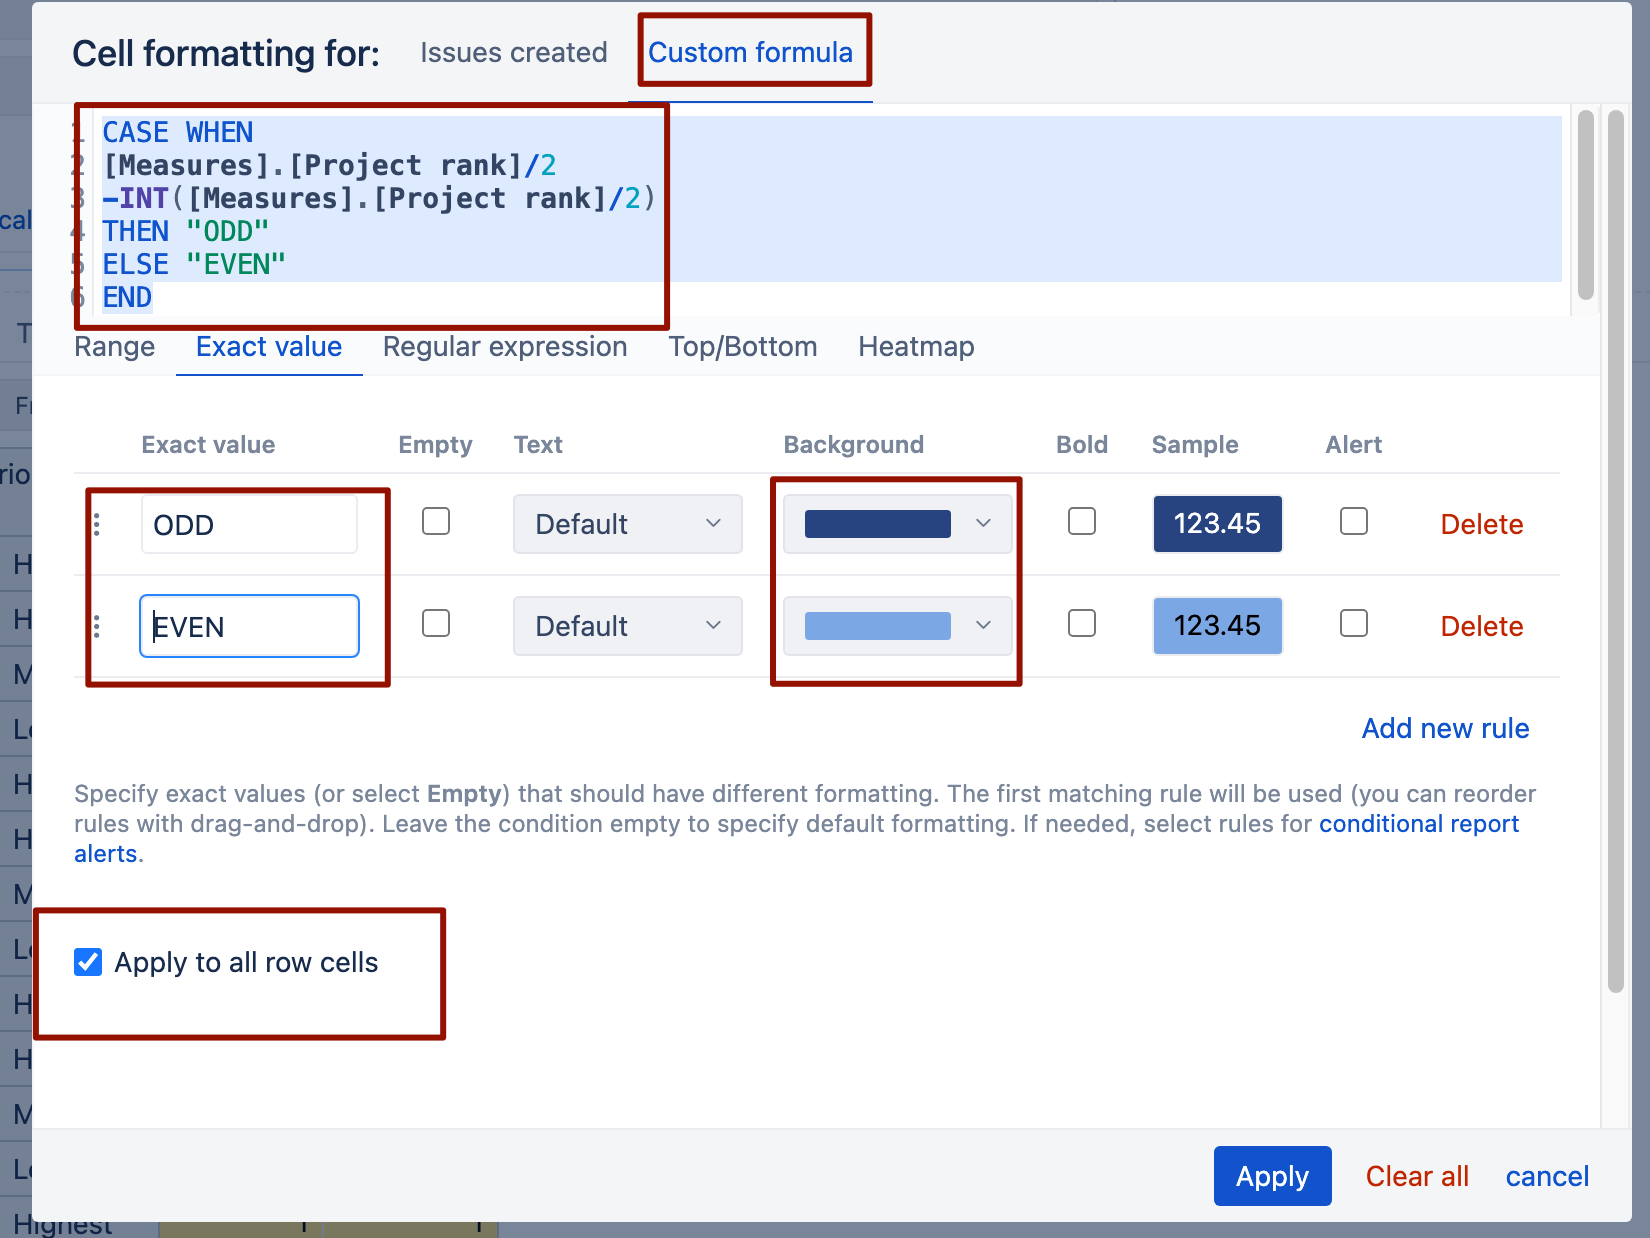
Then use a “Cell formatting” on the column for measure1 with a custom formula:
CASE WHEN
[Measures].[Team rank]/2
-INT([Measures].[Team rank]/2)>0
THEN "ODD"
ELSE "EVEN"
END
OR
CASE WHEN
MOD(
  [Measures].[Team rank],2
)>0
THEN "ODD"
ELSE "EVEN"
END
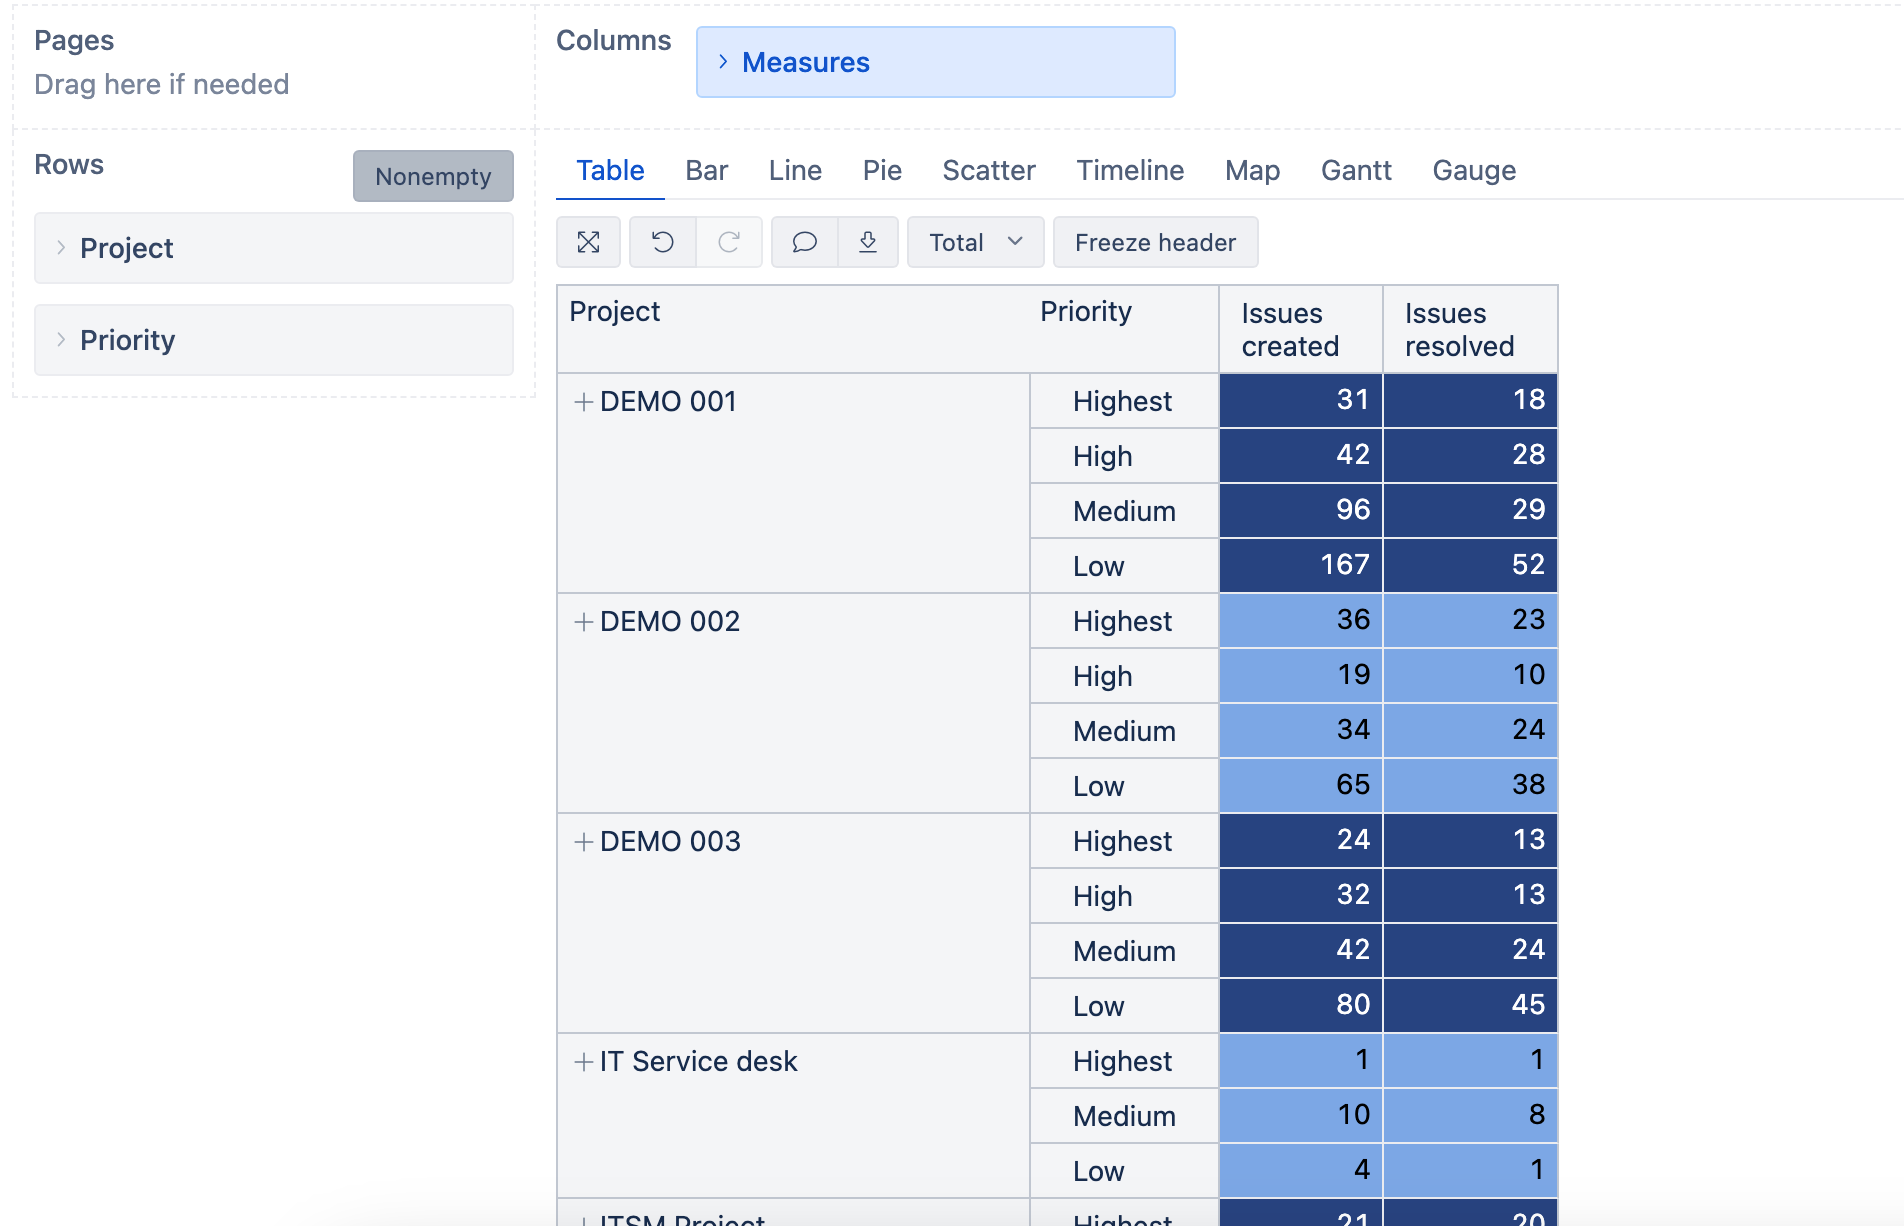
That will let you select one color for “Even” rank numbers and another for “ODD” rank numbers.
And it is enough to create just cell formatting for first measure if you apply the rule for the whole row
Martins / eazyBI
Great!
Works Perfectly. I wanted the automated way.
Thanks a lot!