Hello,
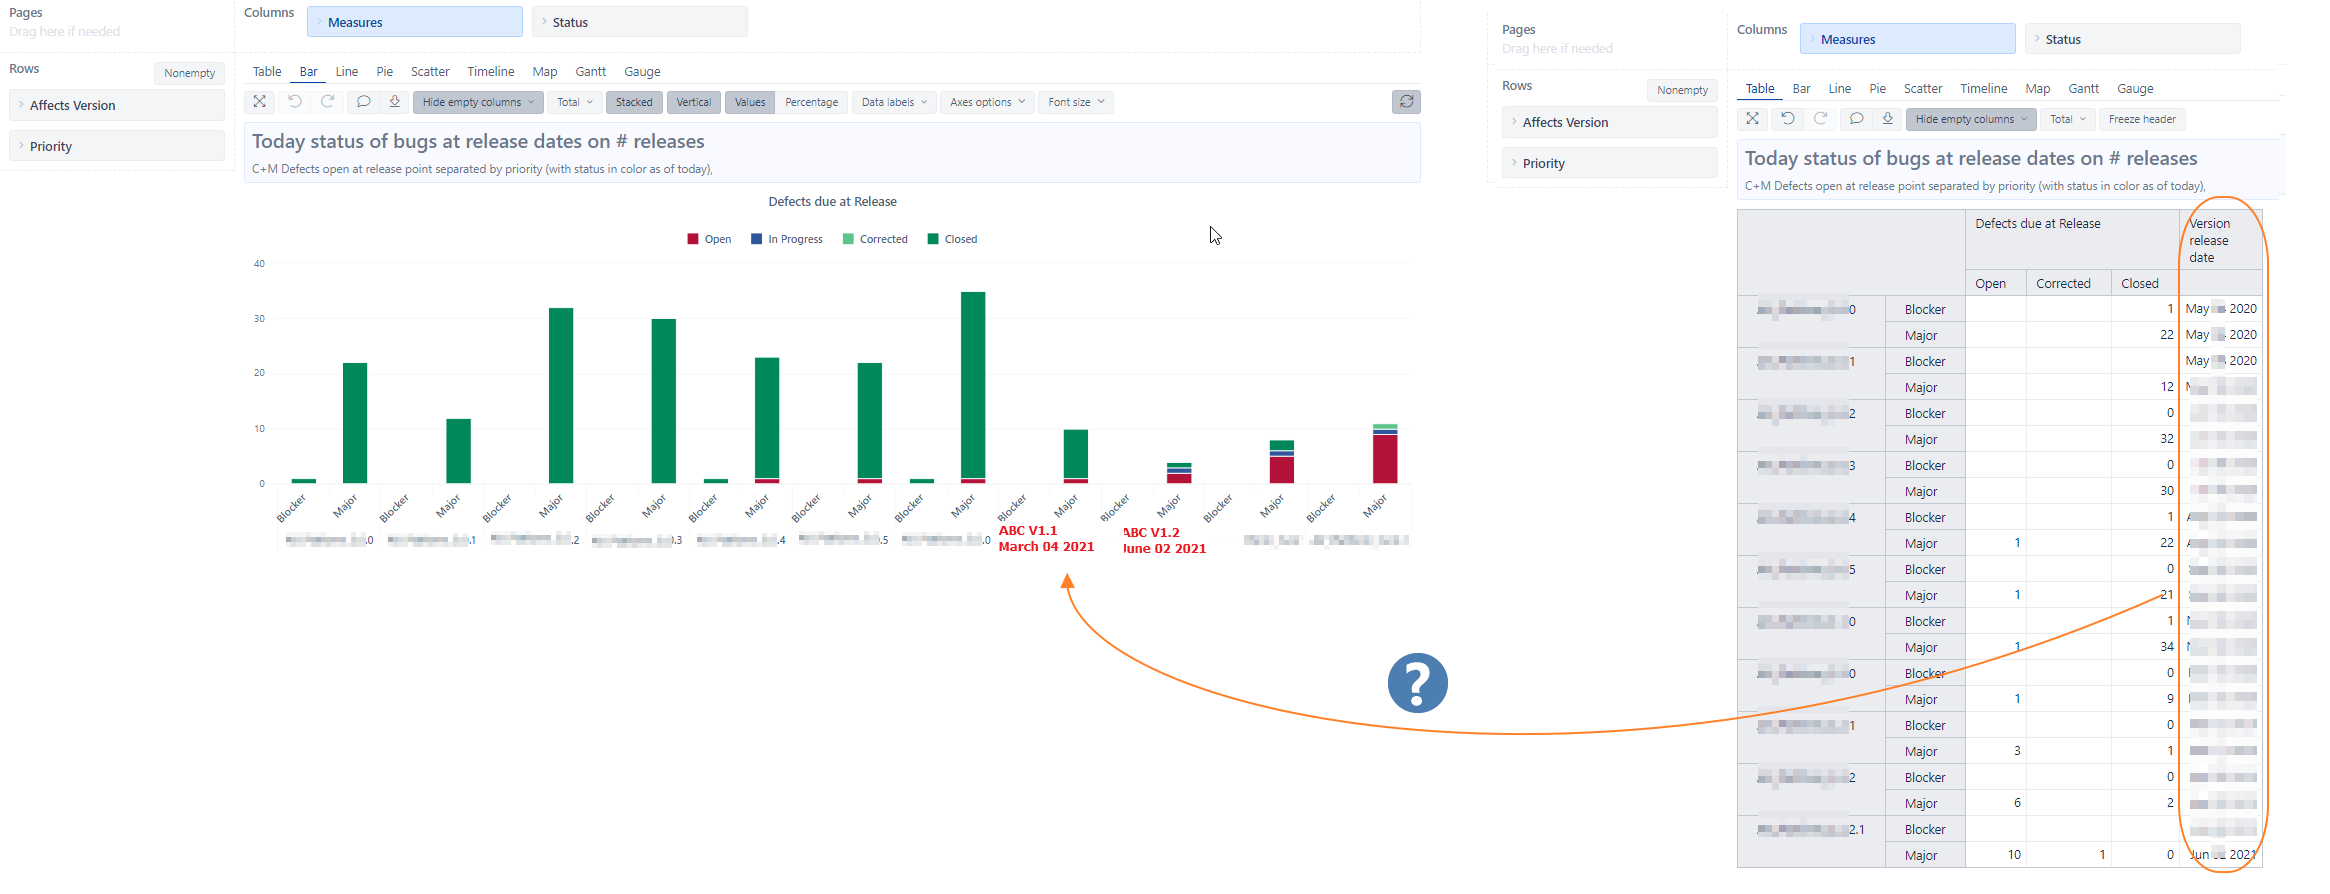
I would like to add the date of a release inside a Bar Chart. The bar graph itself does work as expected and does show per AffectsVersion the number of defects in different state. Now I would like to “print” also the date of each release within the graph (below the release name). I can add the release date easily as a new measure in the table, but then it does - of course - mess up the graph ;-).
Can someone please guide me on how the achieve this in the right way.
Many thanks
Christian
Hi @Christian1!
Adding it to the report as you have done in the table would be the right choice. Only, in the chart, you would need to change the Type to a vertical line or scatter on separate axes and add the data label.
To avoid duplicating release dates, instead of using the default Version release dates measure, you can add a calculation that shows the date only for one of the Priorities with the formula:
CASE WHEN [Priority].CurrentMember IS [Priority].[Highest]
THEN [Measures].[Version release date]
END
The result would be similar to the following:

Lauma / support@eazybi.com
Hello @lauma.cirule, many thanks for your solution. This works pretty well on my site.