Hello!
I’m new to easyBI. I need some help creating a report that I’ve been constructing manually in google sheets.
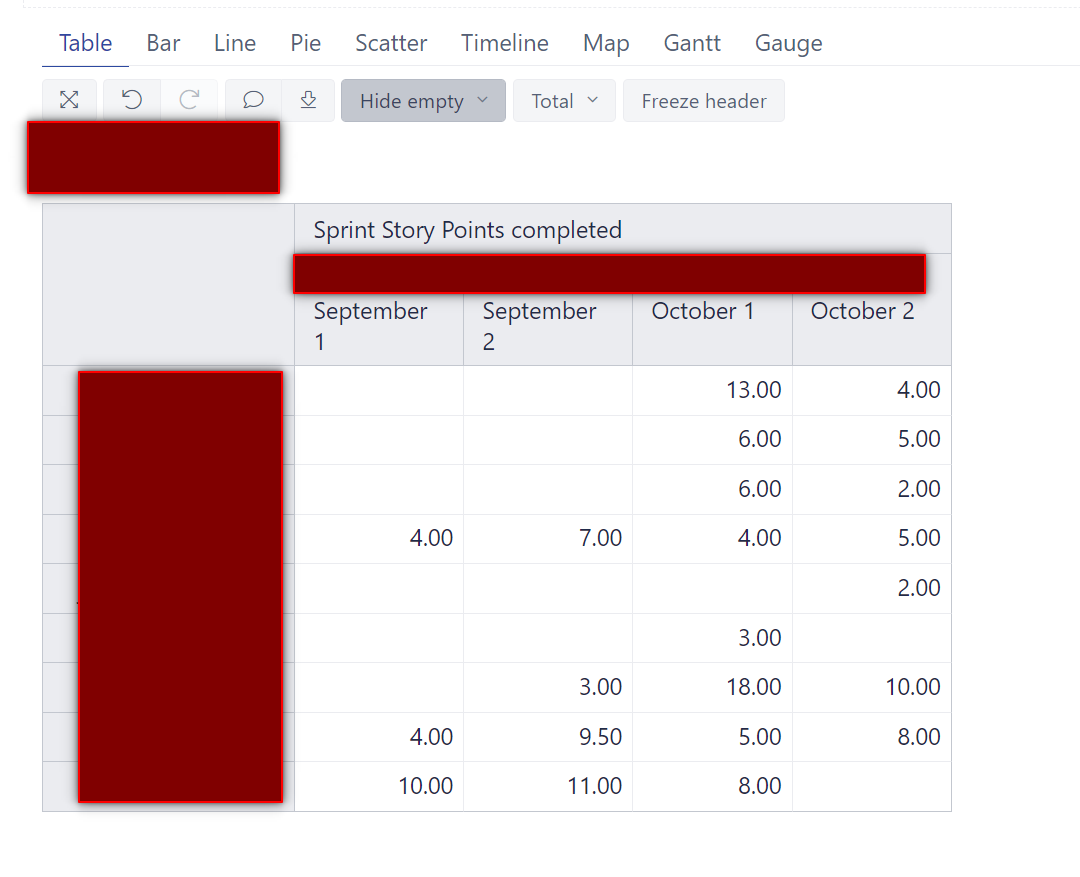
I’m trying to display the story points completed by developer per sprint in the last 4 sprints. Each sprint is a column. I’m also wanting to display average velocity for those 4 sprints by developer in a separate column.
I’ve figured out how to show completed story points by developer, but not sure how to automatically filter to the last 4 sprints being displayed. Also, I haven’t figured out how to calculate the avg sprint velocity per developer.
Here’s the google sheet:
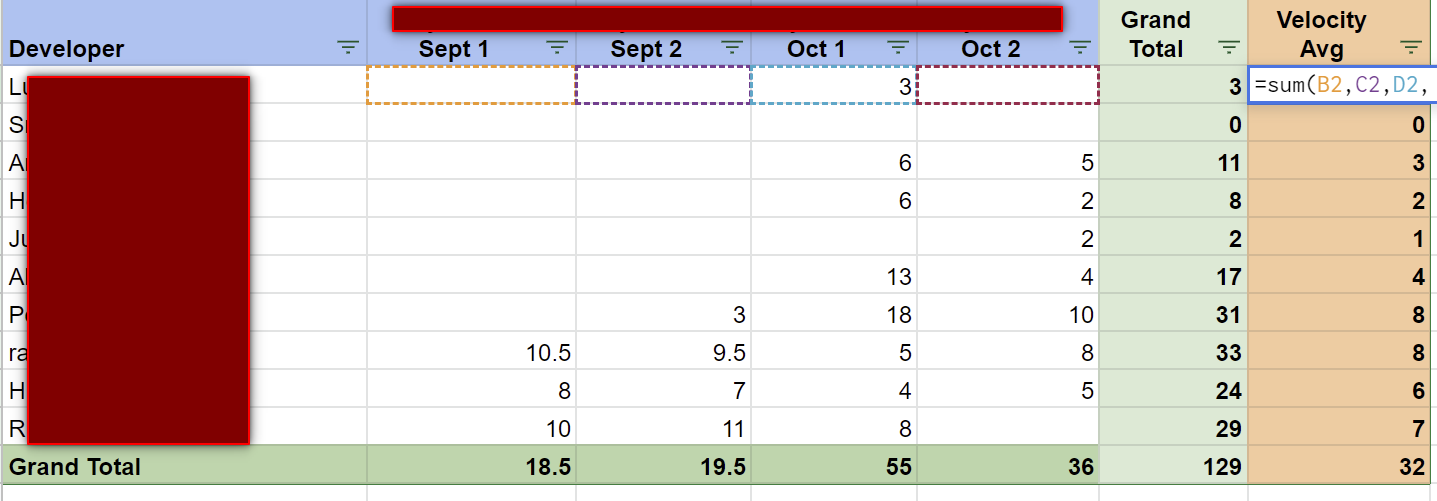
avg velocity = =sum(B2,C2,D2, E2)/4