Hello @pete1 ,
Measure < Cycle > days of resolved issues is linked to the Time dimension by the resolution date. It is the total number of days issues spent in any status of the cycle for completed cycles.
While Average < cycle > days on the Time dimension, is grouped by the last date when the issue moved from the cycle to any other not-cycle status.
You can read more about how cycle days are calculated and linked to time dimension in the documentation page: Issue cycles
And measures Days Flagged Impediment resolved/created/due/closed is linked by resolution, creation, due date, or closed at date. Read more about total number field measures here: Jira custom fields
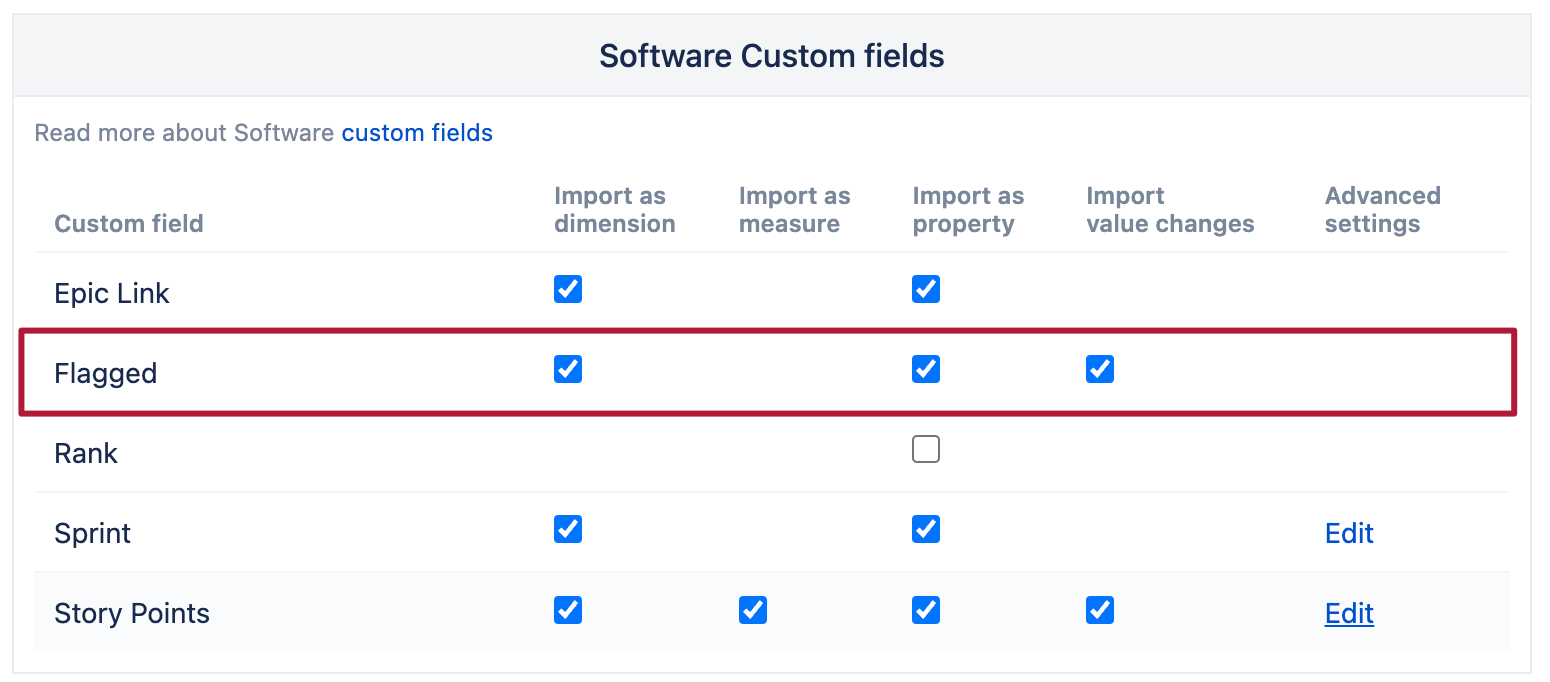
Regarding your original question, you can select change history for the “Flagged” custom field:
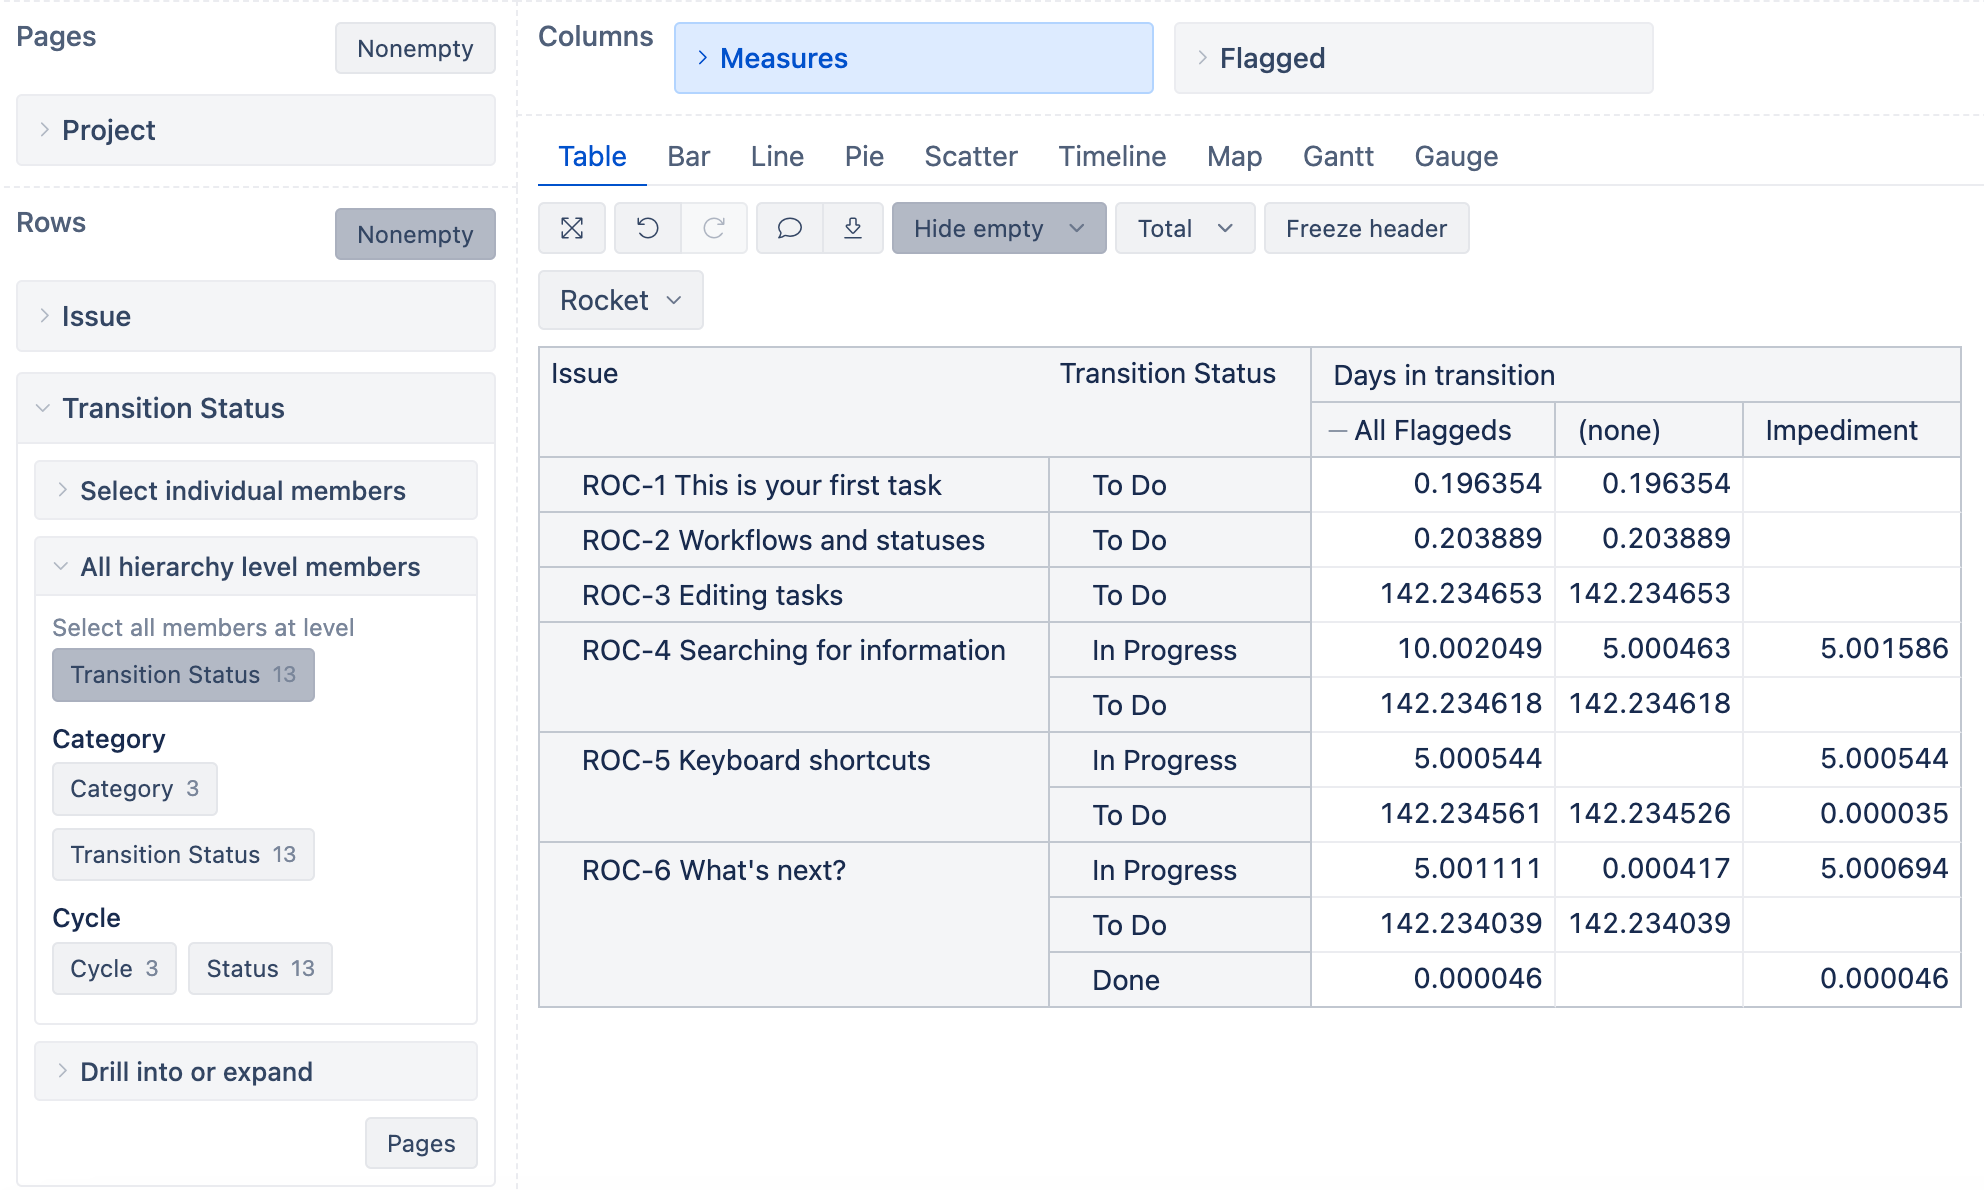
Then, you can use the dimension “Flagged” with the “Transition status” dimension and measure “Days in transition” to see the combination of the flagged issues in particular statuses (or use the “Cycle” hierarchy from the “Transition status” to see the days split by cycles).
Kindly,
Gerda // support@eazybi.com