I have about 8 pie charts in a report, and I’d like two pie charts per row rather than three so I can read their (long) titles. Thanks! 
Hi @fratcliffe,
we don’t have this kind of customization. Pie chart count in one row is dynamic and depending on how wide is your browser window and how many pie charts can fit in it.
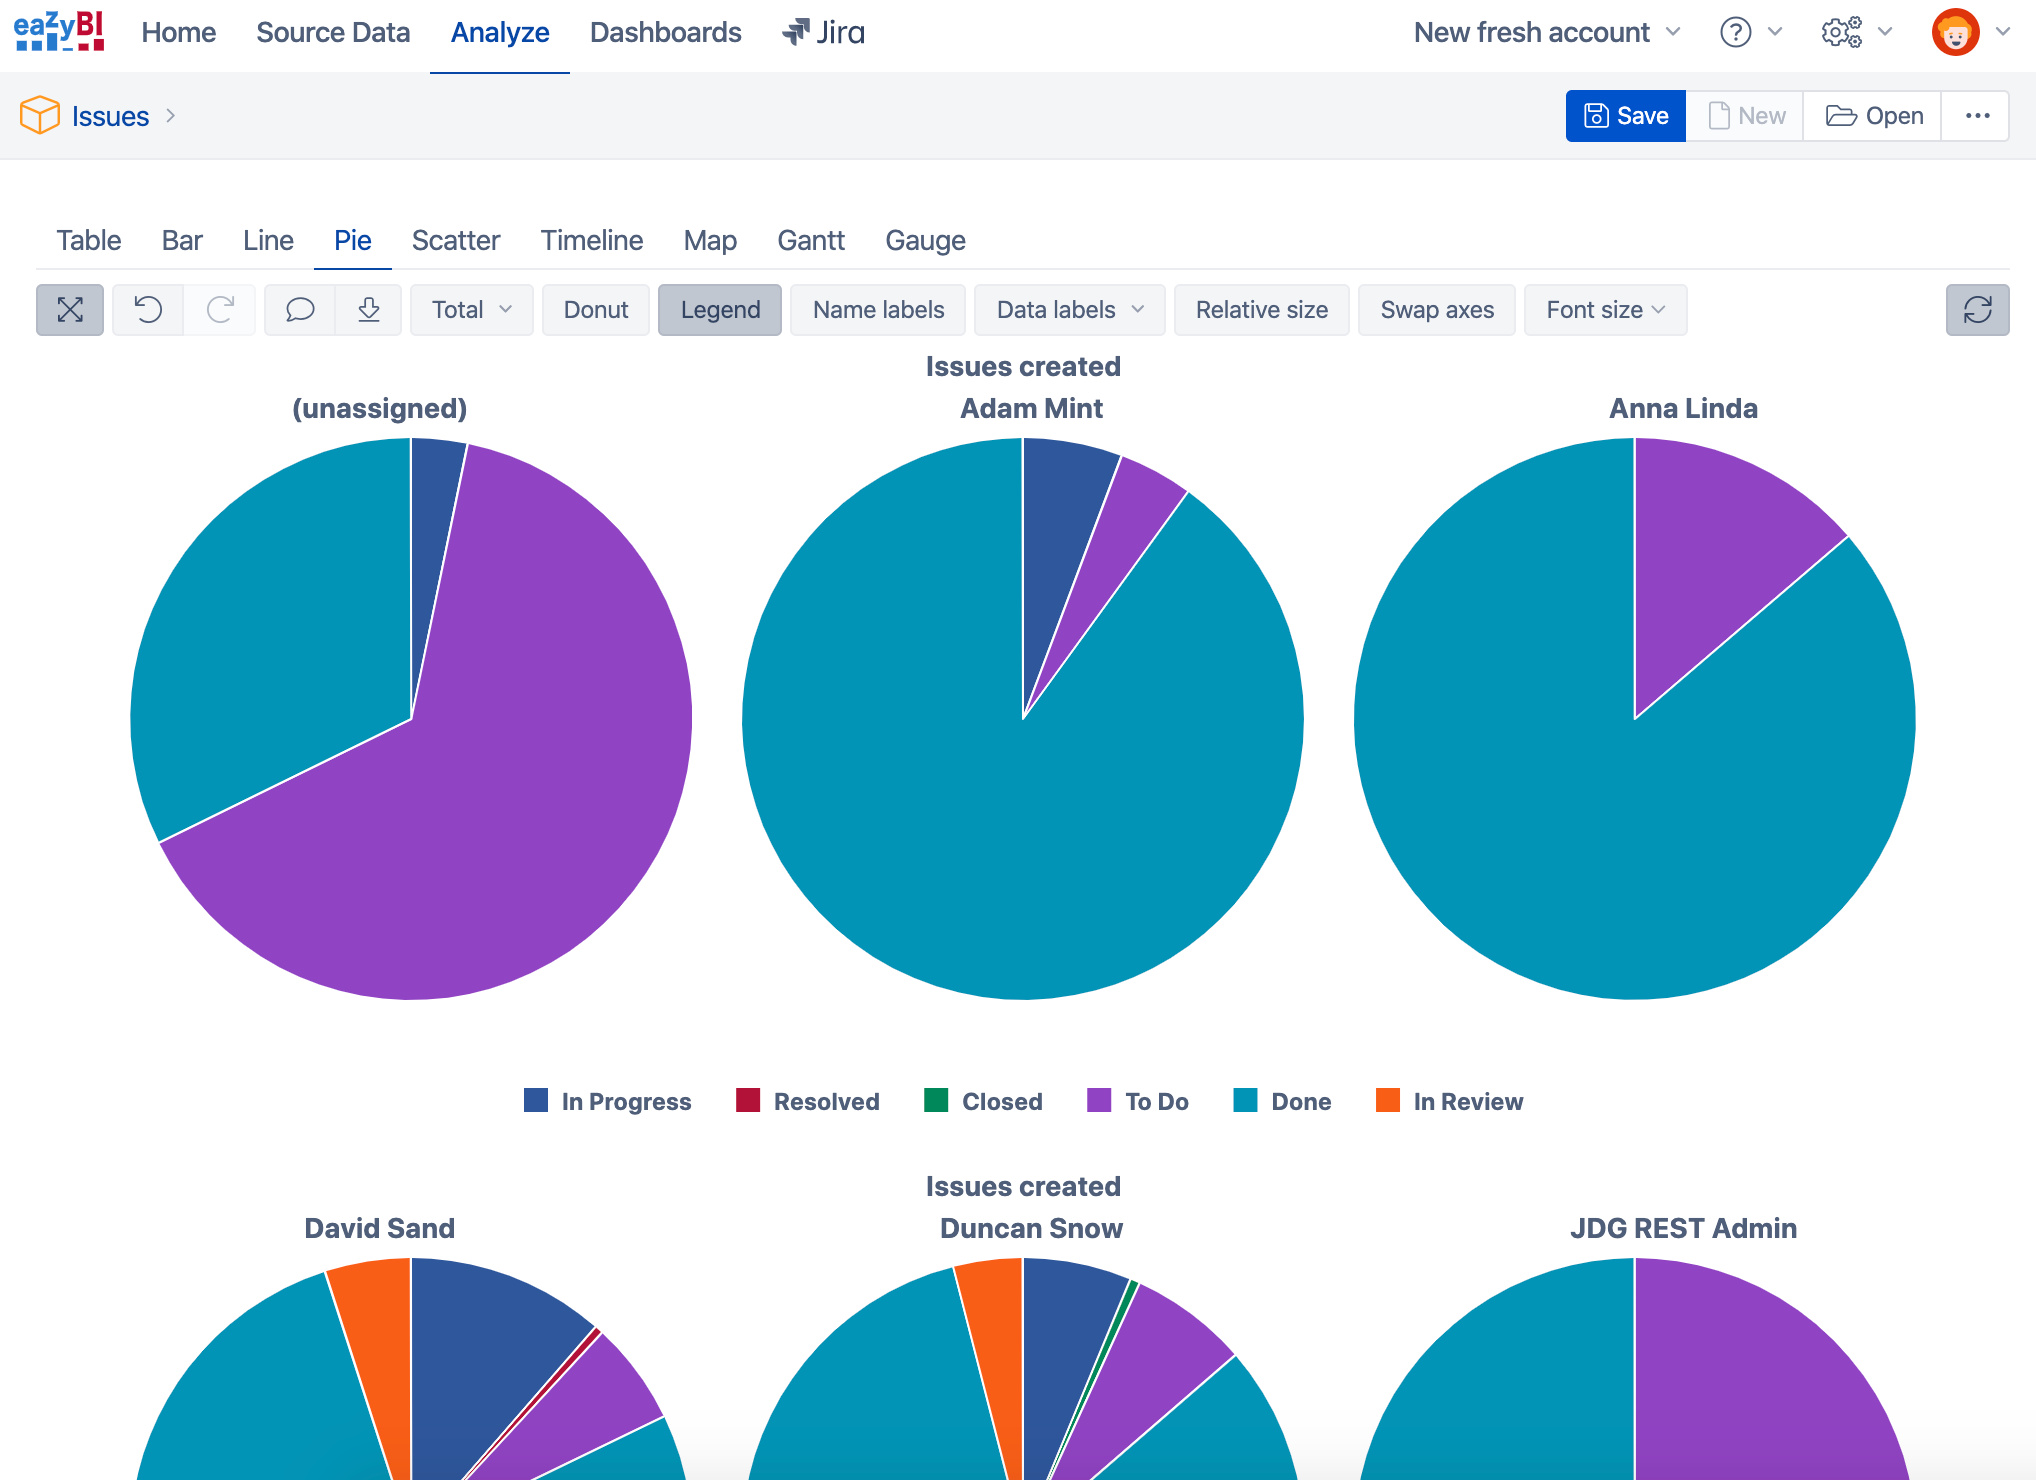
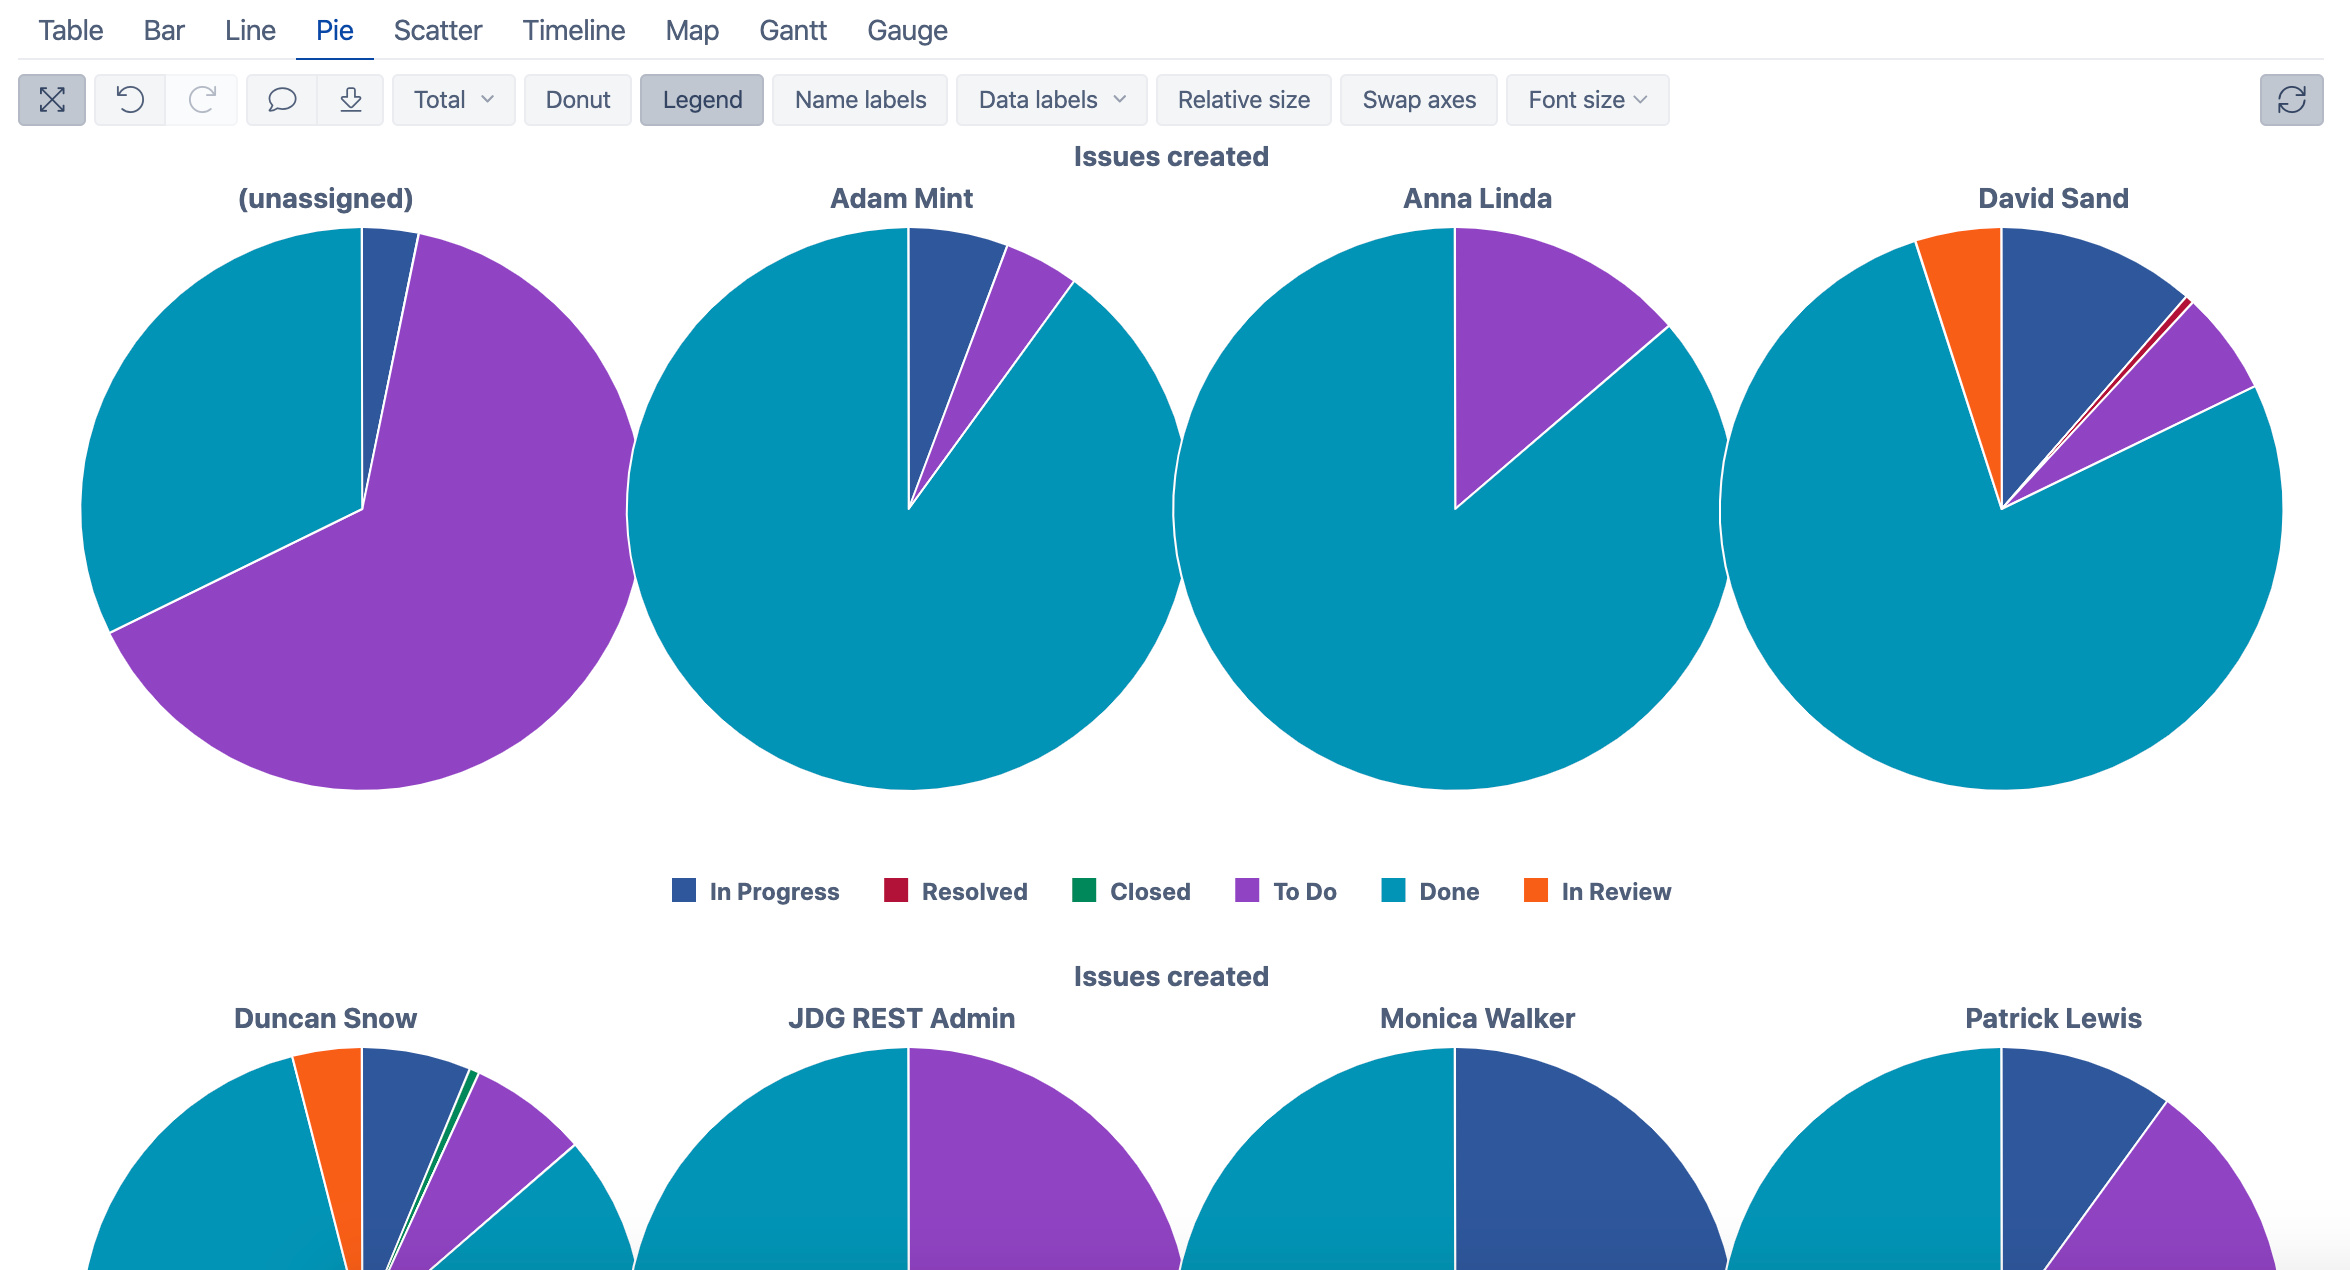
Like this with the same report:
- 3 pie charts per row
- 4 pie charts per row
Maybe for your use case, it would be better to use bar charts?
You can see some advice from our colleague about different chart types - https://docs.eazybi.com/eazybijira/learn-more/training-videos#Trainingvideos-6.Datavisualization:Howtopicktherightcharttype(30min)
best,
Gerda // support@eazybi.com