Hello!
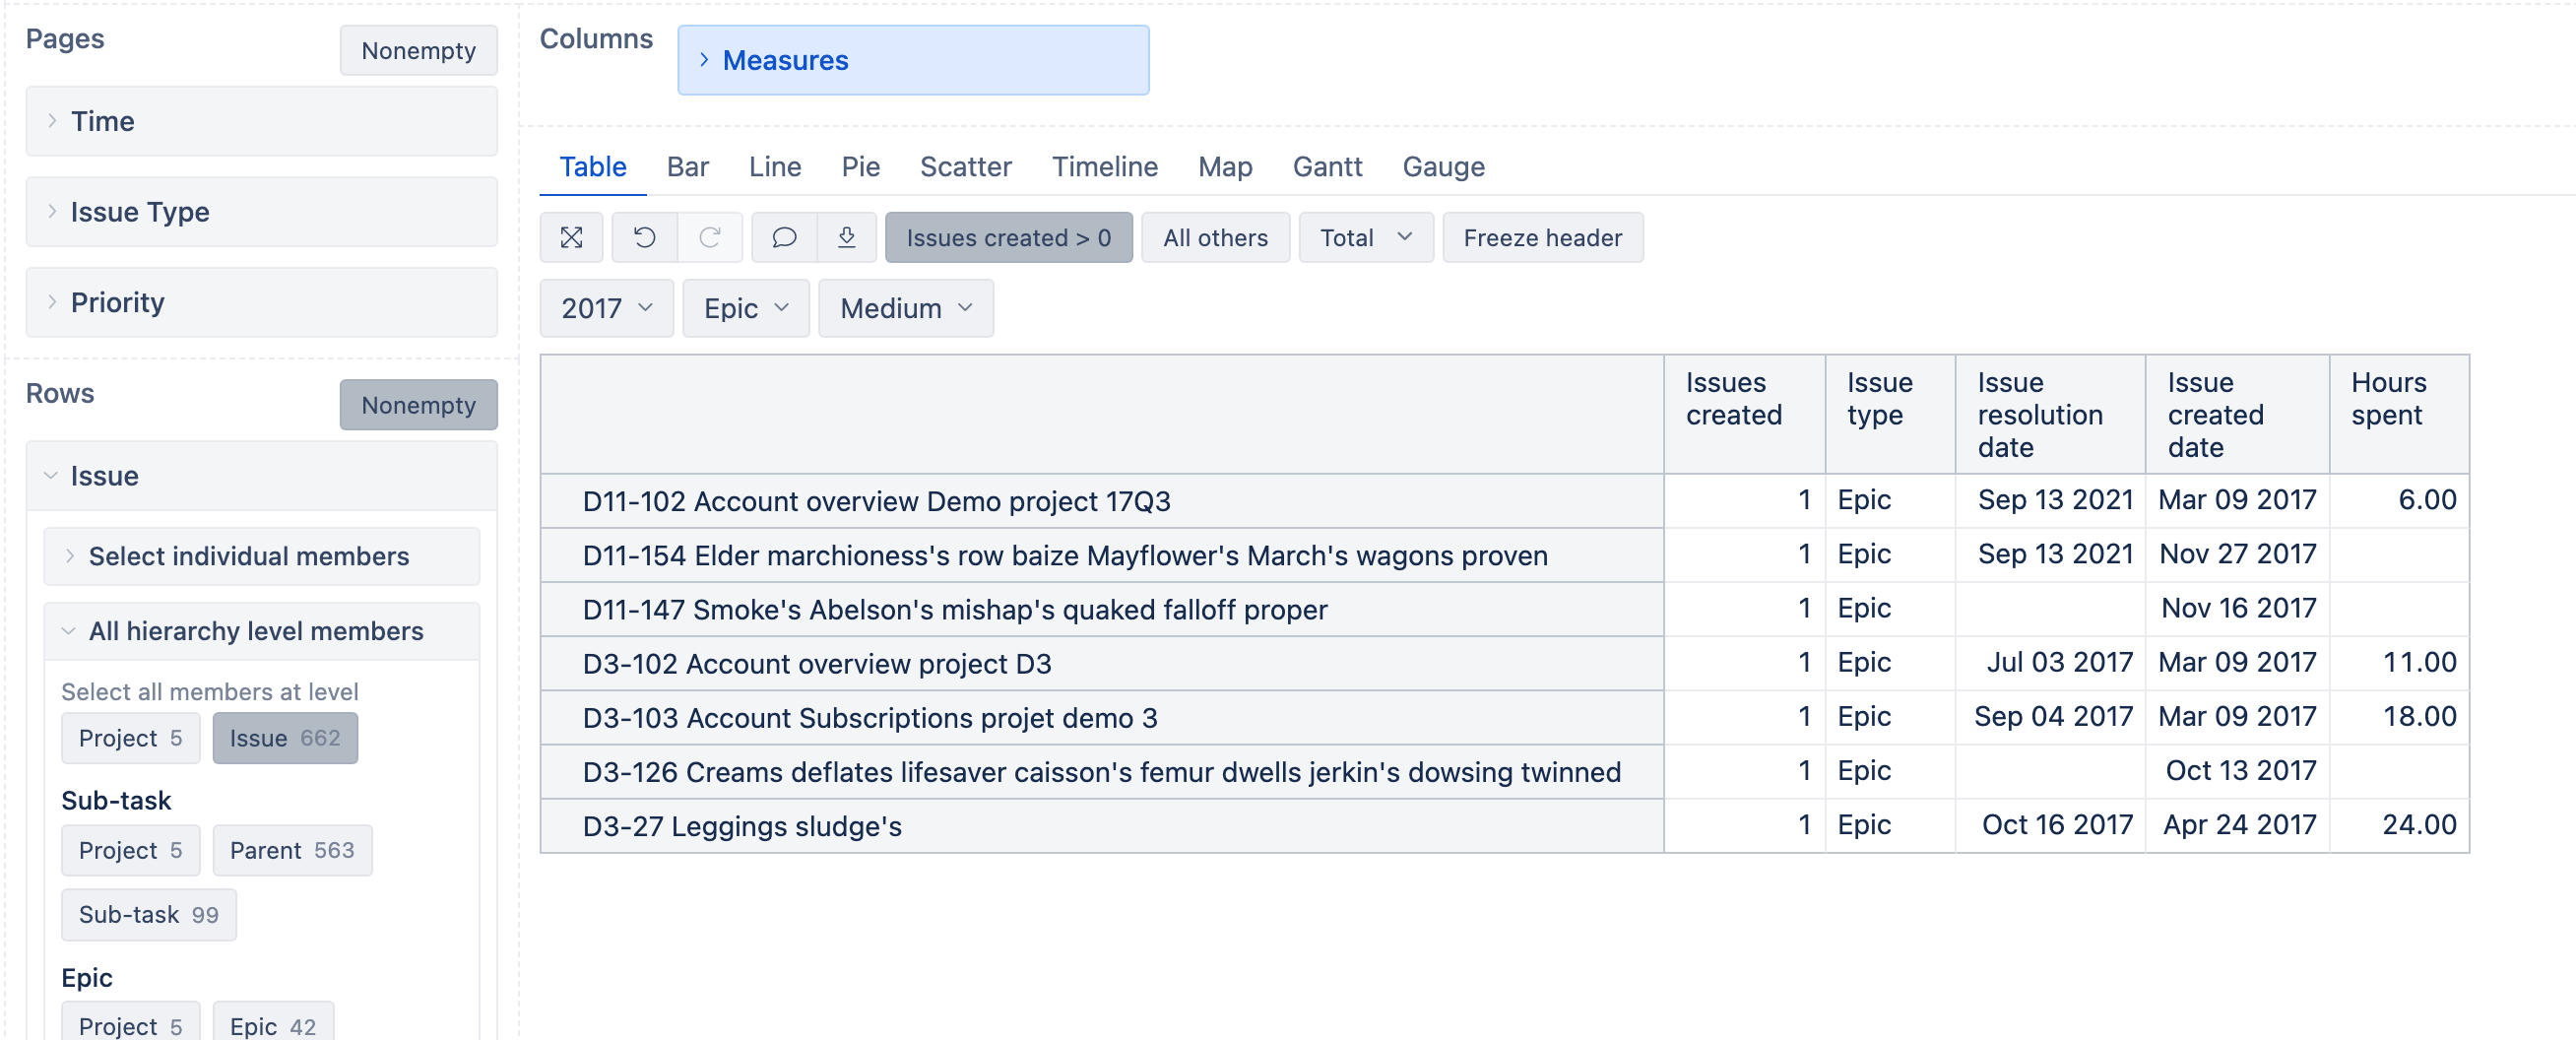
Due to our JIRA setup and reporting needs, we rely heavily on Issue calculated members to select specific groups of work items. For example, to select all issues that are/have been part of a specific Sprint. This gives a nice summary row on the Calculated member Level and allows expanding and see the individual items in the calculated member.
Now I’m struggling to use same approach when selecting a cross section of two issue groups.
A simple Aggregate with Manual selection works just fine:
[issue].[Manual Subset]
Aggregate(
{
[Issue].[Issue].GetMemberByKey("ProjectX-001"),
[Issue].[Issue].GetMemberByKey("ProjectX-002"),
[Issue].[Issue].GetMemberByKey("ProjectX-003"),
}
)
While more complex selection looses the “summary” feature.
[Issue].[Committed Quarter 24/Q1]
Aggregate(
--filetr items that are/were in quarterly development Sprints
  Filter(
    [Issue].Members,
    CoalesceEmpty([Issue].CurrentMember.Get('Sprint IDs'), '') MATCHES '.*(^|,)(31831|31830|31829|31828|31826|31825)($|,).*'
    --select only those that are children of Epics. Epics that are part of the Quarterly (Sprint) commitment
AND
    (
    [Issue].[Issue].GetMemberByKey([Issue].CurrentHierarchyMember.get('Advanced Roadmaps Epic')),
    [Measures].[Sprint issues committed],
--Quarterly Sprint ID
    [Sprint].[Sprint].GetMemberByKey('29329')
    ) > 0
 )
)
I’m quite ceratain that I’m misusing Tuple in this Filtering. Any suggestions how I could achieve the expected subset of Issues while still being able to
- Expand to see individual issues in the calculated member
- See the totals on the calculated member level row
Hi @mucenieks
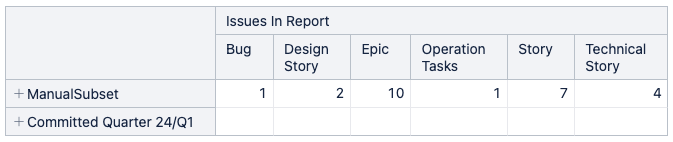
The summary feature is not lost but empty. It doesn’t show anything for an empty set of issues. Likely, your dynamic set doesn’t return any issue by two filter conditions.
Usually, we don’t recommend creating calculated members with aggregates in the “Issue” dimension to avoid having long sets. All other dimensions are ok, but the “Issue” dimension which most of the time has more than 1000 issues imported in the dimension, would give you headaches in the future if you use aggregates there.
The Mondrian engine (which MDX is using) won’t like aggregates with more than 1000 children, and it can result in weird report errors or even kill the report with “internal server error” without any other explanation - when using such aggregates in calculated measures. This is why we don’t recommend it.
In your case, I recommend “moving” these filters to a new calculated measure where you calculate the value of a measure and filter result there.
Try this formula for new user-defined calcualted measure (and select the “integer” formatting manually for output):
SUM(
Filter(
Descendants([Issue].CurrentMember,[Issue].[Issue]),
    CoalesceEmpty([Issue].CurrentMember.Get('Sprint IDs'), '') MATCHES '.*(^|,)(31831|31830|31829|31828|31826|31825)($|,).*'
    --select only those that are children of Epics. Epics that are part of the Quarterly (Sprint) commitment
),
CASE WHEN
    (
    [Issue].[Issue].GetMemberByKey([Issue].CurrentHierarchyMember.get('Epic Link')),
    [Measures].[Sprint issues committed],
--Quarterly Sprint ID
    [Sprint].[Sprint].GetMemberByKey('29329')
    ) > 0
THEN
1
END
)
Next, you could use “Issue type” dimension in rows and two calcualted measures in columns or vice versa.
But without knowing how you calculate the “Issues in report” calculated measure, it was just my first guess for the steps I would recommend.
Martins / eazyBI team
Hey @martins.vanags
Thank you for the fast and qualified answer. This indeed is a good solution and I will implement it as one of the requested reports in dashboard.
At the same time there is a requirement to generate bigger tables that show many different values for a subset of issues. For example a table that lists all 24/q1 Quarter Epics (rows) and then 10 different measures in columns. For example, Commited/Adhoc, Updated Date, Story Points of all Children, Status, Resolution, Child progress, etc. For such tables it is necessary to use calculated members. Fortunately these tables have significantly less than 1000 rows and so far function quite well.
Is there a way to transform such aggregate multi argument filters to produce sets as output?
BR,
Jānis Mucenieks
p.s. Sveicieni visiem VeA 
Theoretically, you can transform them, but we don’t recommend this approach because we can not always explain why the report stopped working.
In the use-case mentioned above, I would still recommend creating calculated measures where all the arguments are coded in formulas if you need the result to be filtered by the sub-set of issues in each of the columns.
And then use the “Issue” dimension at the issue level in rows, and filter the report by Page filter “Epic” and perhaps other filters.
Or use an additional column as a filter just to show a list of epics for the given report context (page filter selections).
p.s. paldies par sveicieniem! mūsu te ir vairāki
Thank you for the proposed alternatives. The option with column filter and Grouping through epics is indeed a working solution and something we already use in The Big Epic table. This is a very good approach when the grouping is based on existing hierarchies and properties.
In this one use case that we are working on, we do need a real calculated group. Even precalculating on import would not work as the groups are based on multidimensional, dynamic relationships between JIRA items.
What is this “theoretical” approach to transform? I am aware of the limitations, performance penalties and increased error occurrence.
What would be the way to get a “set” as an output from the original example: [Issue].[Committed Quarter 24/Q1] ?
Hey @mucenieks
By “theoretical” approach, I meant the solution you reported in the first post. I guess you can get some results for the sub-set with the right syntax. But that is not what we recommend.
Instead, we would perhaps recommend splitting the requirement into multiple different reports and avoid having sub-sets (calculated members) in the “Issue” dimension that use members in other dimensions.
You can check various interaction possiblities: Interact with report.
The star schema (used for eazyBI reports) expects that a “measure” is how you connect report dimensions to calculate results.
Martins / eazyBI