Bonjour tout le monde,
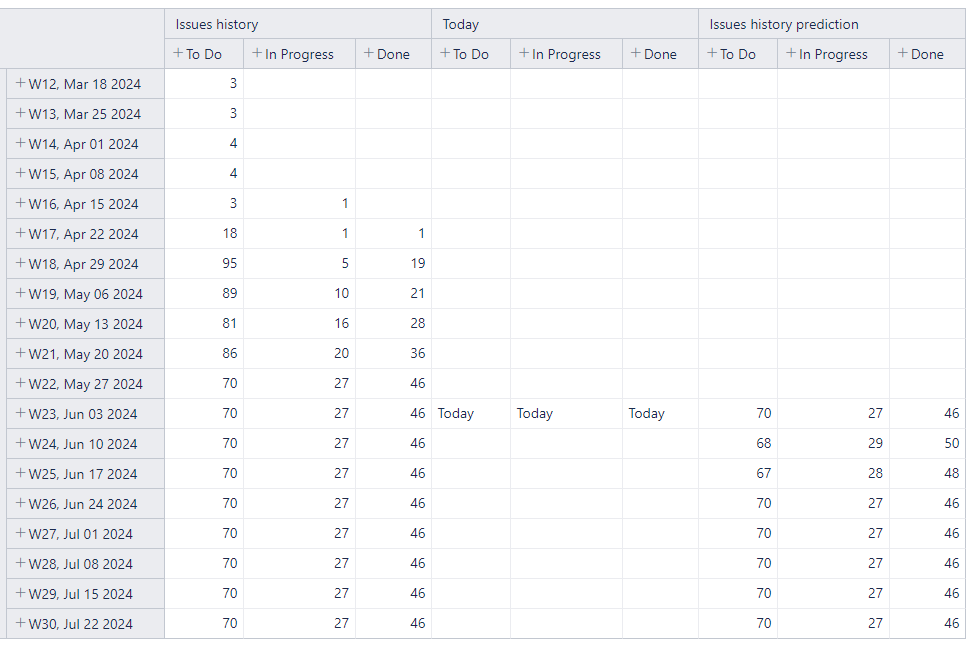
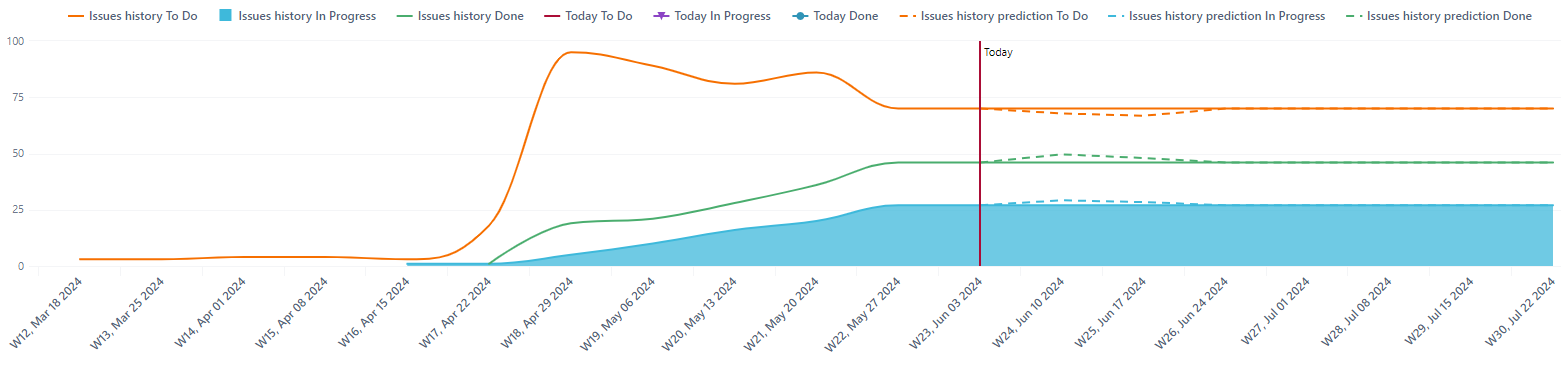
I’m making a graph to display the history of tickets to do, in progress and finalized. On the graph, I’d also like to display the day’s line, then draw prediction curves based on figures from previous weeks.
However, I have 3 worries:
- issues history curves continue after the current date. Is there a trick or do I have to create a new measure with a case when to check the date?
- For the vertical today line on the chart it’s ok. Except that I actually have 3 vertical today lines. It’s not very clean in the legend. Is it possible to hide some legends?
- More complex (perhaps). My prediction doesn’t really reflect the prediction based on the latest trends. The last few weeks have seen the number of “to do” tickets drop: 95-89-81-86-70. I wonder why the prediction doesn’t go down. Probably because of my formula

Here is my prediction formula
CASE WHEN
DateCompare(now(),[Time].CurrentHierarchyMember.StartDate) <= 0
THEN
LinRegPoint(
DateToTimestamp([Time.Weekly].CurrentMember.StartDate),
LastPeriods(5, [Time.Weekly].CurrentMember),
[Measures].[Issues history],
DateToTimestamp([Time.Weekly].CurrentMember.StartDate)
)
WHEN
DateInPeriod(‘Today’,[Time].CurrentHierarchyMember)
THEN
NonZero([Measures].[Issues history])
END
END
Thanks you very mutch, I’m interested in any tips, I know a bit about EazyBI but there’s still so much to learn ![]()