There is a ton of info on measuring/counting how long an issue has been in a certain status, or switched status or other transitions, and I’m pretty good with this stuff but I can’t come up with a calculated measure to know when an issue change from one issue type to another (the specific types don’t matter… in my case our support group flips issue types based on a number of factors and want some analysis around this). I am importing issue history and have tried to model all those many measures related to status (such as days in transition status) and edit them for issue “type” but have been unsuccessful after > 20 hours of trial and error. Can anyone provide the calculated measure code I may need to count this kind of transition? (such as how many issues changed type in a certain time period and the average time issues remained in a certain issue type?)… Thanks in advance
Hi @erichard00
Changes of issue type are registered in issue change history and also imported into eazyBI.
You may define a new calculated measure In Measures to count how many issue type changes have been for each issue and in total. For calculation use a tuple of hidden measure Transition from and hidden dimension Transition Filed.
( [Measures].[Transitions from],
[Transition Field].[IssueType] )
Best,
Zane / support@eazyBI.com
Hi Zane,
Appreciate the support and reply… I created the measure you described (literally) below but not getting what I’m looking for still . (still new to this)
still only getting almost all number 1’s for every issue id… (i need to know for instance if an issue was a bug and a year later is was an RFE, i need to see it was a bug for 365 days and also an RFE for 1 day somewhere)
-what do i use for my rows dimension? (right now I have “issue” and selecting individual issuetypes for members)… this may be wrong
-not sure if I’m supposed to be substituting something specific for my issue types somewhere in the measure you sent or use it as is and change something else to show the numbers i need?
thanks,
Ed
btw… for specifics on my issuetypes, one real one for me is called “L3 Support” and another is “Escalations to R&D” in case you wanted to use those in a reply… also, on further research it looks like i would need the “Issue Type” dimension dragged to a Column… correct? (and also add “Time” dimension somewhere?
begging for help now… just put in another 10 hours of experimentation, trial and error with no good results…aaaaaarrrrrggggghhh!
Hi @erichard00
The calculation
( [Measures].[Transitions from],
[Transition Field].[Issuetype] )
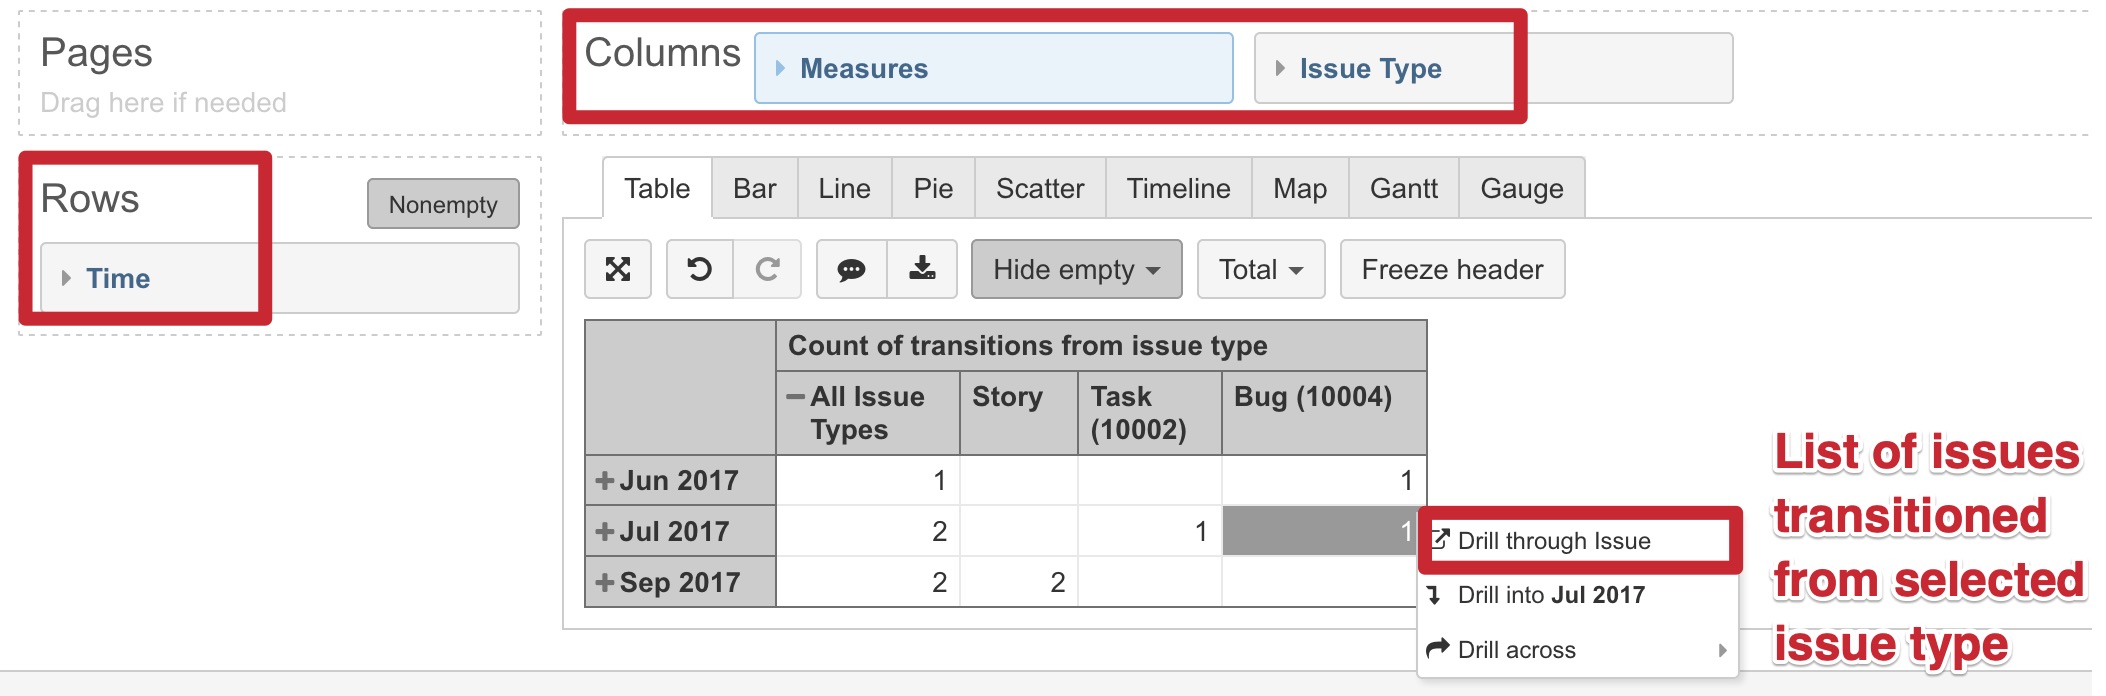
returns how many times issues have changed issue type. When using this calculated measure with Issue Type dimension then calculation represents how many transitions were from each issue type. If you want to analyze those change over time, you may add Time dimension or rows; measure represents how many issue type changes were in each period.
To get a list of issues which changed the issue type in each period, you may click on measure value.
When you are building some report and get stuck, please add information how far you have got and point out what is still missing, or what is your struggle point. This information helps to understand your use case and better assist you to find the most appropriate solution.
Best,
Zane / support@eazyBI.com
@zane.baranovska,
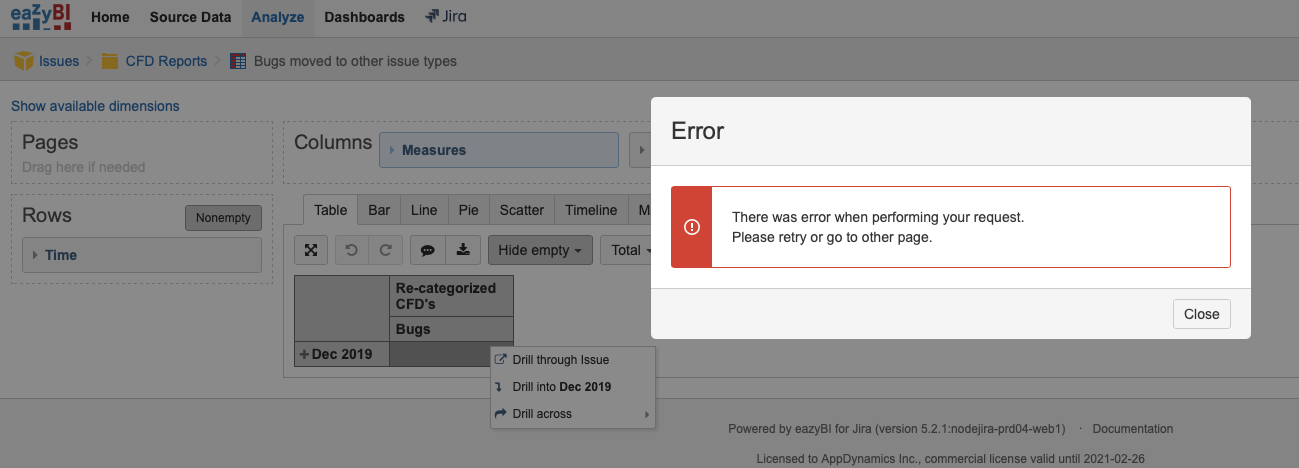
I just recreated your screenshots and the drill through issue does not work
Hi @jeff.tillett,
eazyBI is well suited to create overview reports due to the multi-dimensional data model and how data are structured there. Unfortunately, it is not working so well to get a list of items from large data cubes with many issues. Even you have drilled down a quite specific period of time when choosing “Drill through issues”, eazyBI goes through all issues and validates whether they match selected criteria (selected values on rows, columns and page filters).
One option is to modify the calculation for “Re-categorized CFD” so it would contain two parts: one part would work when running the report to get the count of transitions (formula as it is now) and another part would work only when drilling through individual issues. The second part would contain a bit different calculation that is optimized for going through individual issues. A similar approach is used for measure “Open issues”.
Another option, you may disable Drill though option for this measure at all, not to confuse users with activity that can not be completed (https://docs.eazybi.com/eazybijira/analyze-and-visualize/calculated-measures-and-members#Calculatedmeasuresandmembers-Specialcommentswithannotations).
Third option, you might consider creating a separate account with fewer issues for detailed reports.
Best,
Zane / support@eazyBI.com
Hi @zane.baranovska,
Is it possible to get the total transition number between two specific Issue Types?
Thanks.