Hi all!
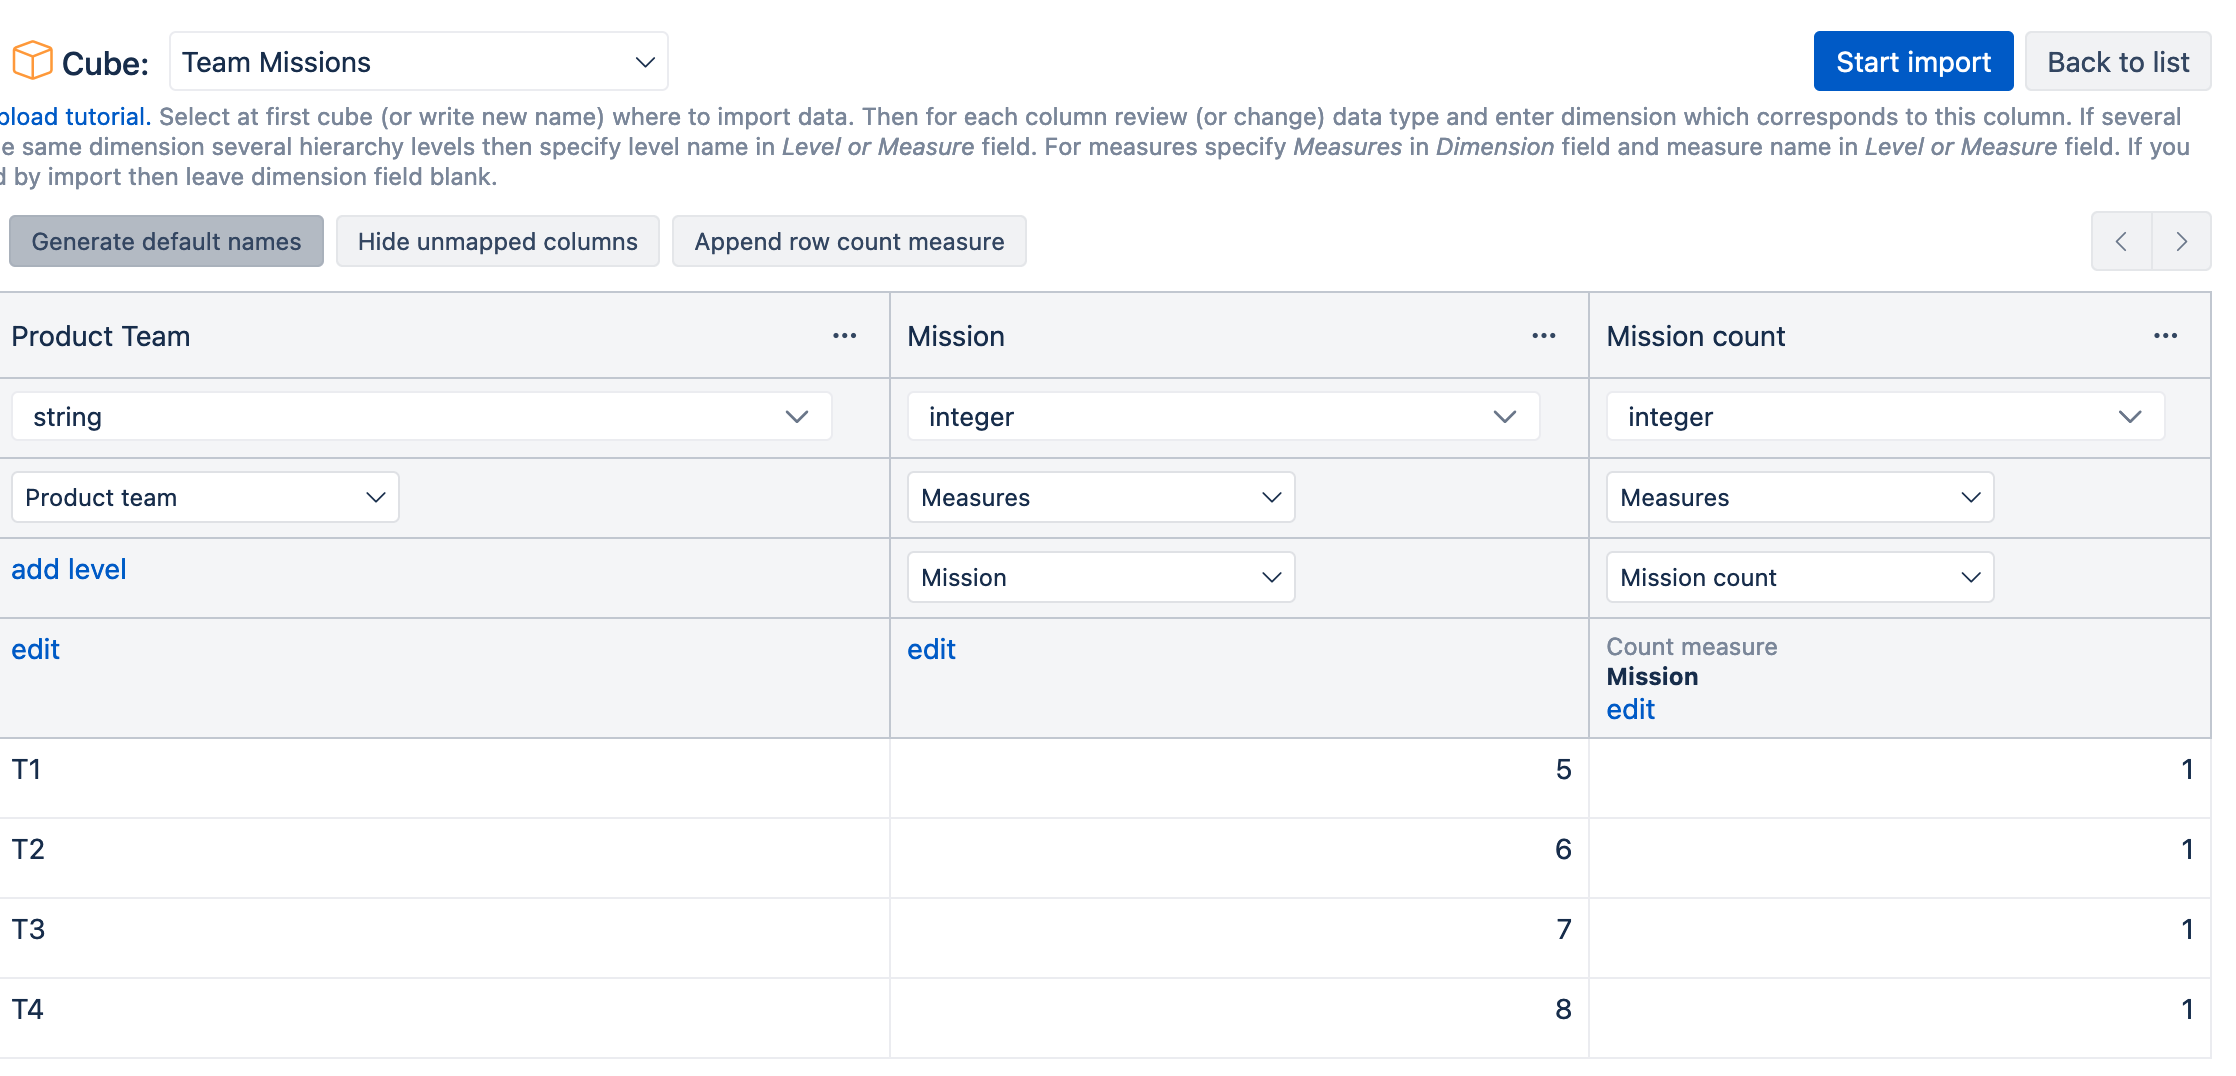
I have an excel where I am importing extra data, 10 KPIs every time, for several teams every quarter.
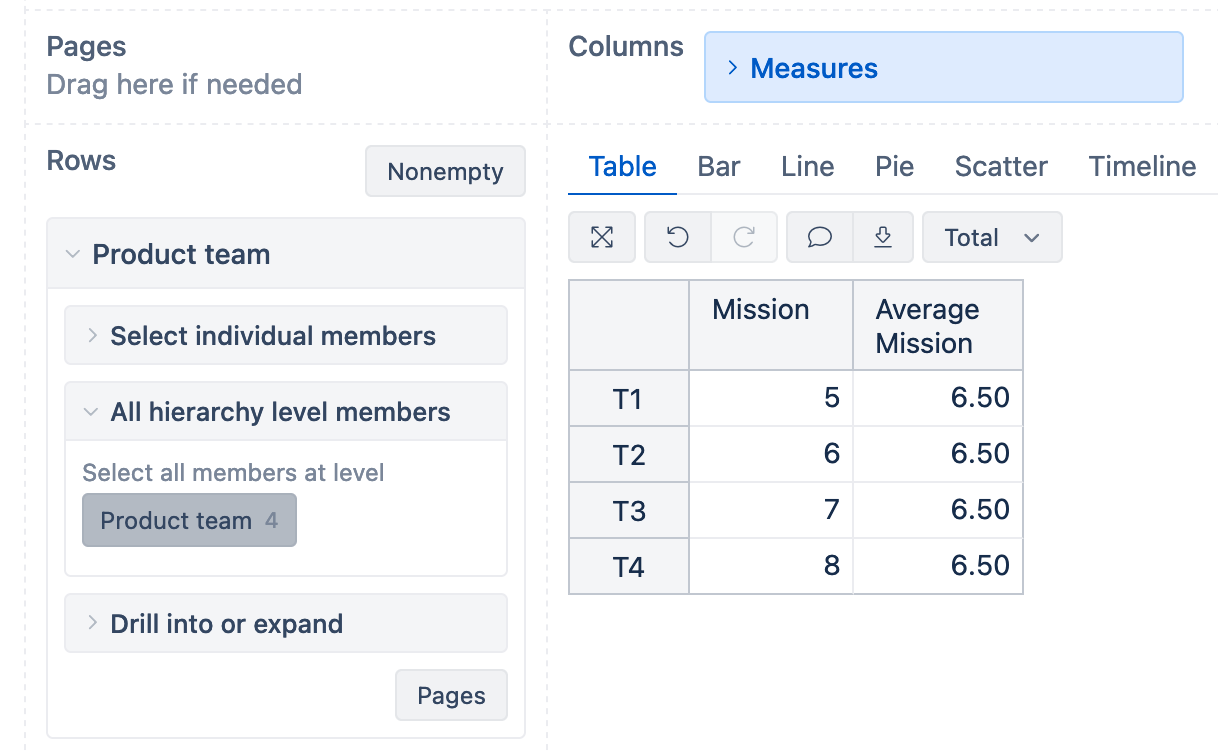
And every KPI we want to import it is indeed an average of all of the answers submitted by the team that quarter.
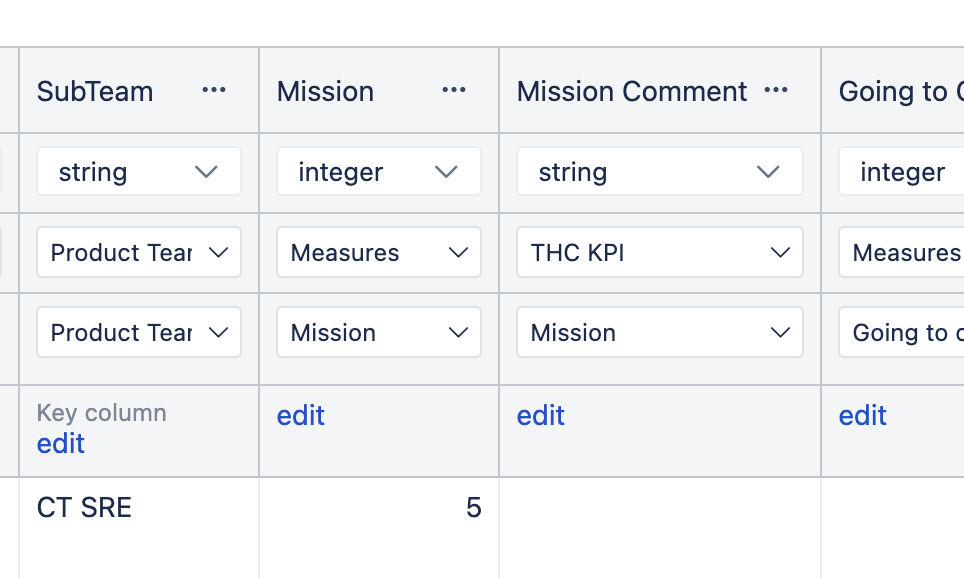
So, I added the “Row Counts” and I tried to create the AVG by JS code, for instance for Mission column, with the “add calculated Column”:
return doc.Mission / doc."Mission count";
or
return doc.Mission.value /  doc."Mission count".value
or
return doc["Mission"] / doc["Mission count"]
But the value appears as empty always.
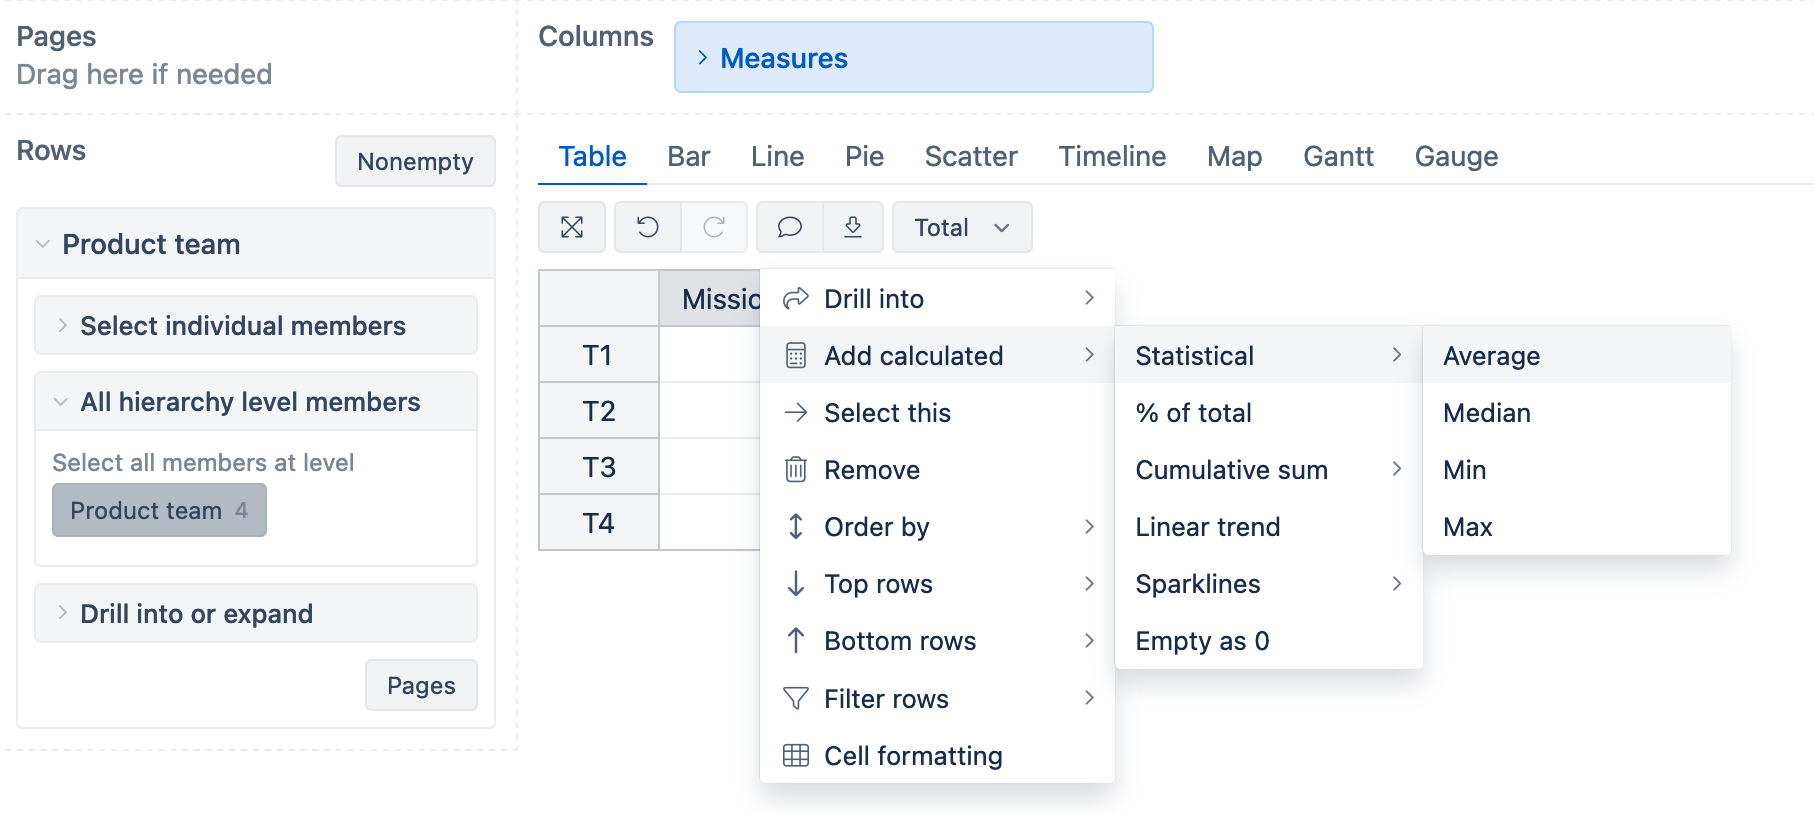
How can I create the AVG during the import phase to have that KPI already as “AVG” per each team?
Instead of creating a Measure doing that, because I will have doubled each one.
Thanks!