[JIRA]How to create chart count assignee working at a time

Hi all,
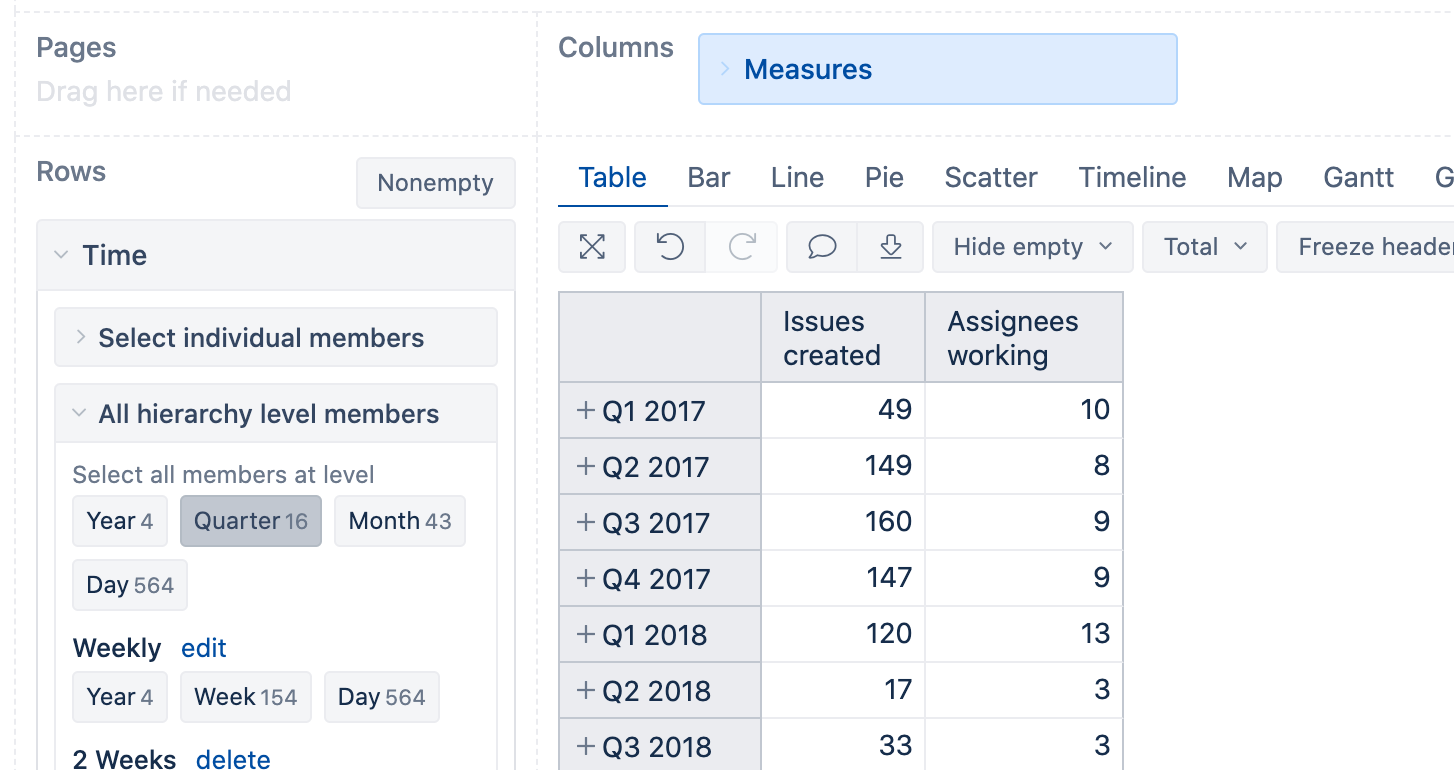
i need create a chart(line chart: issues created and assignee working this time) show up number assignee working at a time
ex:
Q4 2019: 1000 issues have 5 assignee working
Q1 2020: 1500 issues have 6 assignee working
Q2 2020: 1200 issues have 3 assignee working
Q3 2020: 1800 issues have 5 assignee working
Q4 2020: 2000 issues have 7 assignee working

Pls help resolve this problem thank!!!

pls help. thank you.

Hi,

The simplest solution for this use case could be to count the number of assignees where there are any issues created for this assignee in the period.
The formula would be the following:

NonZero(Count(
  Filter(Descendants([Assignee].CurrentMember,[Assignee].[User]),
  [Measures].[Issues created]>0
  )
))

Kindly,
Janis, eazyBI support

thank u that problem is resolved!

1 Like