Dear community, I am looking for advise IF/how I can use ‘EazyBI for JIRA’ to present the PMI value for (JIRA) projects. This calculated value is based on the number of defects, where the defects STATUS en SEVERITY have different weights (HIGH = 2, LOW =0.5 // OPEN = 3, DONE = 0)
I am looking for a way to calculate this value for:
The entire project
– A specific component within the project
– A specific FixVersion within the project
The charts should be displayed based on TIME so you can see the trend (the PMI should drop during development). Ideally I would like be able to deep-dive…
I am not sure if my question makes enough sense to anyone but I hope that an experienced user might be able to push me in the right direction
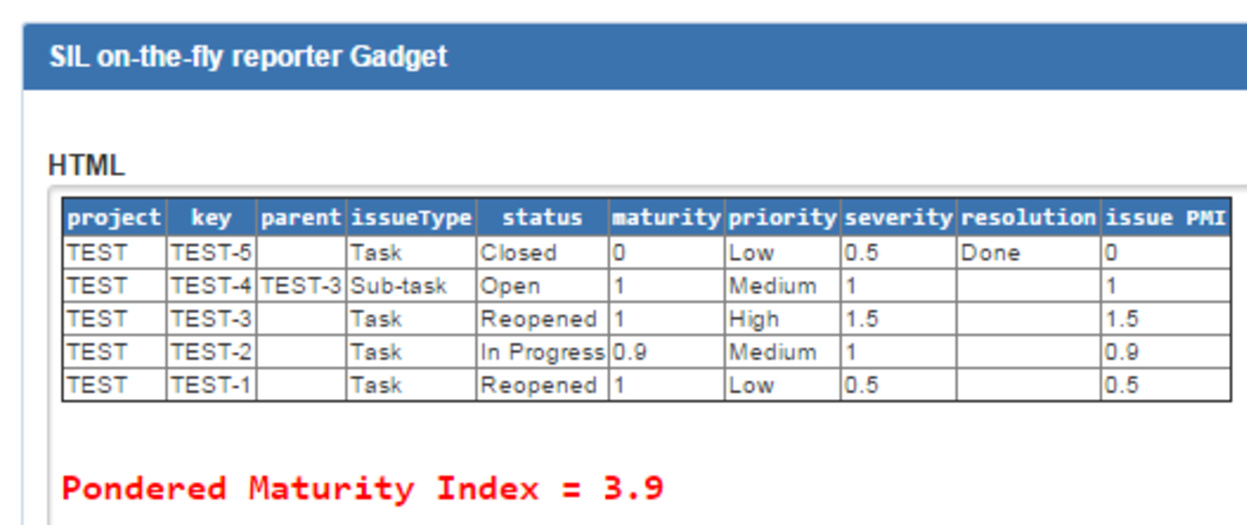
PMI
The Pondered Maturity Index (PMI) is a summation of the number of defects found where each defect is weighted by its (resolution) maturity and severity. PMI can be used as an indicator of the overall quality of the system and offers a balanced measure to decide whether a program is mature enough to be released to the market. Due to the weighting of the defects, the PMI typically evolves more predictable than straight summation of defects and offers more insight into the severity of the overall issues found in the system.
First of all, the PMI approach looks like an interesting one. You will certainly get detailed answer from the EazyBI team but here are some directions to start with:
On pages: Issue Type = Bug , Project = “your project”
On rows: Issues
Columns: Measures, display Status (open = 3, …), and severity (High = 2, …)
Build a formula: Issue PMI = status*severity
Patrick described an option how to calculate PMI for a current situation. You can use simple calculations and use row totals in a table report described by Patrick.
If you would like to see PMI changes over time based on status value at any given period back there, you should use options provided by issue change history import.
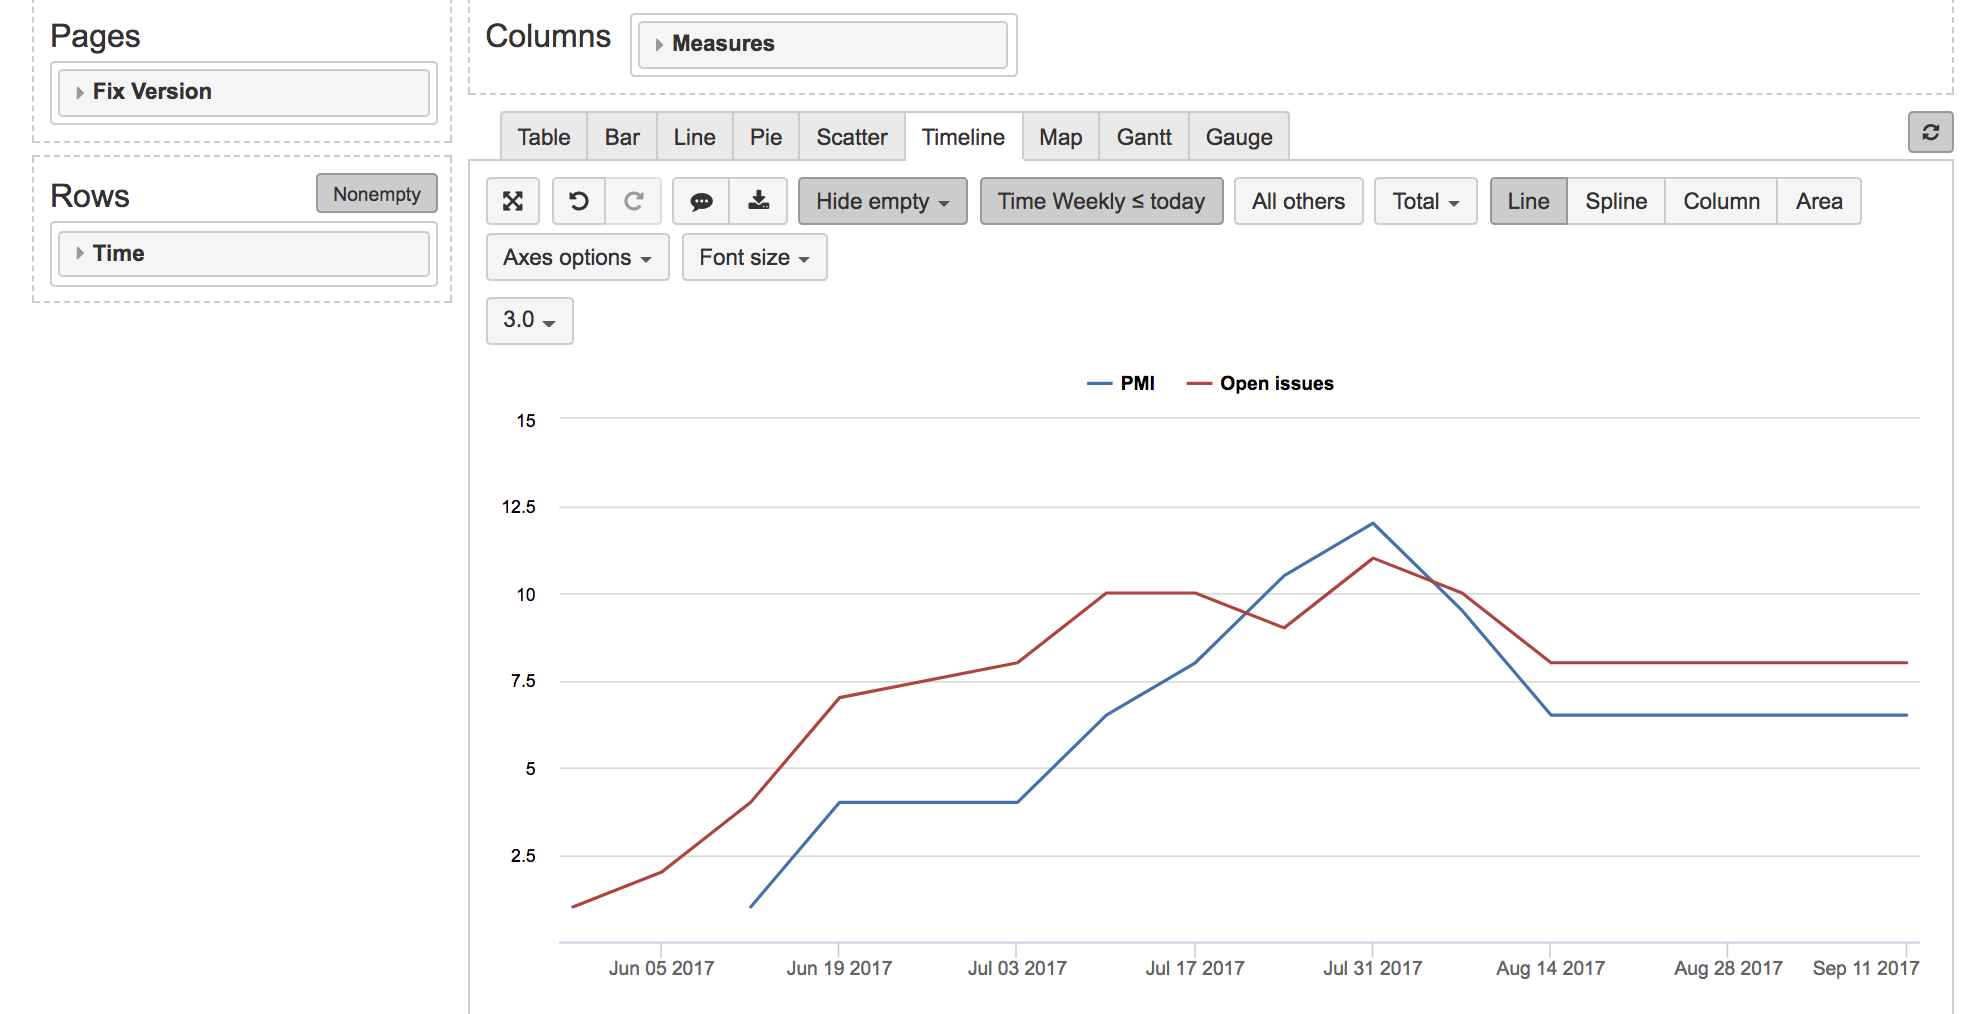
You would like to use Transition status dimension for historical statuses, instead of Status dimension. Here is an example formula how to get total KPI over time:
NonZero(Sum(Filter(
  Descendants([Transition status].CurrentHierarchyMember, [Transition status].[Transition status]),
    [Transition status].CurrentHierarchyMember.name NOT MATCHES ("Closed|Depoyed")),
    Sum(Filter(
    Descendants([Priority].CurrentMember, [Priority].[Priority]),
      [Priority].CurrentMember.name <> "Low"
      AND
      [Measures].[Issues history] > 0),
      -- value by transition status
      [Measures].[Issues history]
      *
      case [Transition status].CurrentHierarchyMember.Name
        when "Open" then 3
        when "In Assessment" then 0.9
        else 1
      end
      *
      -- value by priority
      case [Priority].CurrentMember.Name
        when "Safety" then 2
        when "Critical" then 1.5
        when "High" then 1
        when "Medium" then 0.5
      end
)))
The formula above goes over all Transition status and Priority members and excludes the ones that gives 0 value and sets coefficient for any other Transition status and Priority.
This is chart I got with this measure. In addition, I added measure “Open issues”.