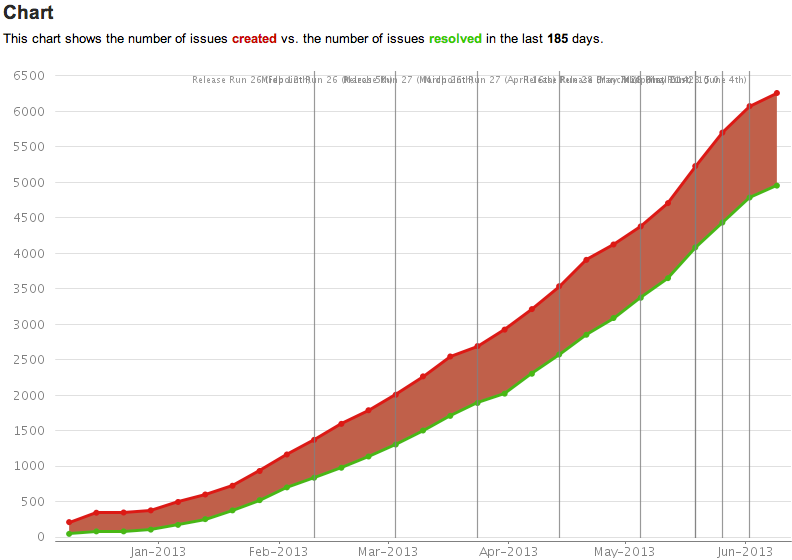
How do I creat an Report like Created vs. Resolved Issue Report from Jira?
https://bugs.opera.com/help/images/reports/createVResolve.png
How do I creat an Report like Created vs. Resolved Issue Report from Jira?
You are looking for some measure representing Cumulative counts of created and resolved issues along with version release dates plotted on a report.
We do not have example reports exactly like that. However, I would suggest to check out two example reports in our demo account you can use to build this one.
The first is project prediction report. It has lines representing cumulative issues resolved and measure issues history that could act as cumulative issues created for most cases.
eazyBI does not have an option to combine any two measures as an area range, though. We had this idea on our backlog. I added a community vote to it and will post any updates here on this chart type.
The second report you can check out is Version releases. It has a measure Version release you can plot as a vertical line in the report. An option to use a vertical line was available in the Timeline chart only for a long time. With eazyBI version 5.2. we added an option to plot measures as a vertical line to Line and Bar charts as well.
You can export both reports from our demo account and import into your account. Then use one of a basis, remove any unnecessary measures from it. Add missing measures from another report. Another option is to view formulas in formula editor and copy the formulas to create new user-defined measures in your account. Create a report with those measures select initial chart type and apply the data representation in the chart to any measure.
Daina / support@eazybi.com