I have a report that I create by hand for Kanban workflow reports. I use JQL to accomplish that in the Jira page view. I’d like to convert this to an eazyBI report that auto generates. based on the JQL measures that I have in place. The requirements that I’d like to view in an eazyBI report are as follows:
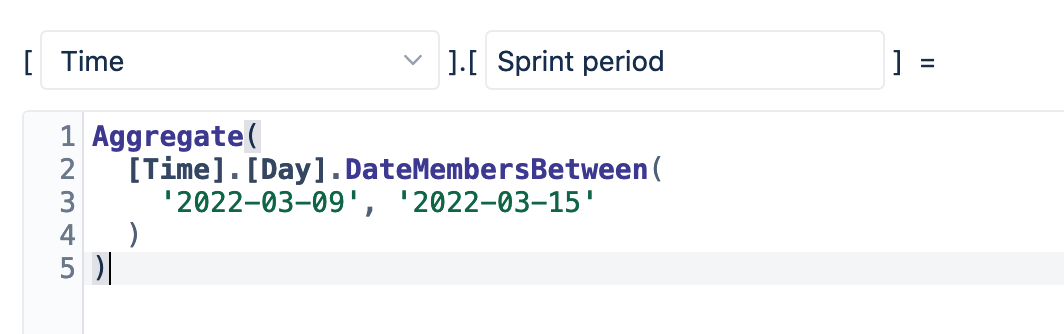
- All measures should be taken weekly on Wednesdays to coincide with grooming day.
- Measure the number of Jira issues that transitioned from “Ready for Dev”->“In Progress” during grooming on Wednesday.
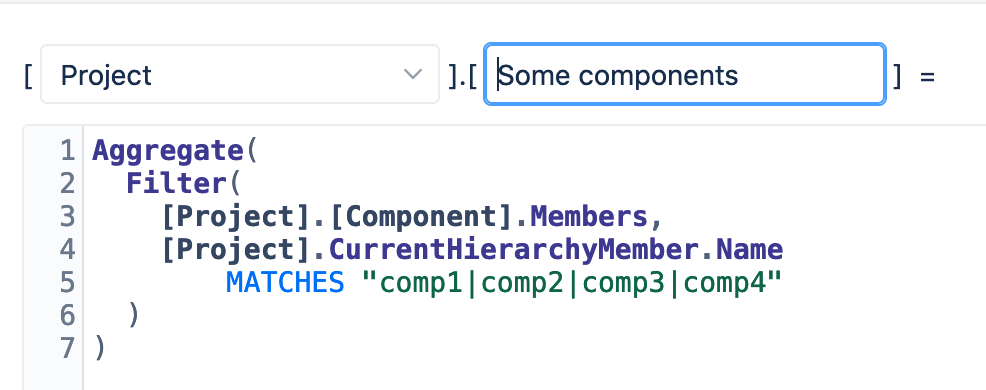
JQL:project = PROJ AND component in ("comp1", "comp2", "comp3", "comp4") AND status changed from "Ready for Dev" to "In Progress" during ('2022-03-9', '2022-3-15') AND (status was in ("Ready for Dev") on ('2022-03-09')) ORDER BY key ASC - Measure the number of Jira issues that transitioned from “Ready for Dev”->“In Progress” that were not groomed on Wednesday.
JQL:project = PROJ AND component in ("comp1", "comp2", "comp3", "comp4") AND status changed from "Ready for Dev" to "In Progress" during ('2022-03-9', '2022-03-15') AND (status was not in ("Ready for Dev") on ('2022-03-09')) ORDER BY key ASC - Ready for Dev Snapshot on Wednesday
JQL:project = PROJ AND component in ("comp1", "comp2", "comp3", "comp4") AND status was in ("Ready for Dev") on ('2022-03-09') ORDER BY key ASC - Ready for dev → In progress total for the week Wednesday to Tuesday
JQL:project = PROJ AND component in ("comp1", "comp2", "comp3", "comp4") AND status changed from "Ready for Dev" to "In Progress" during ('2022-03-09', '2022-03-15') ORDER BY key ASC
I’d like to visualize it as a bar graph.