I am trying to create a report in a timeline that shows stacked in columns and as percentage or numbers about how many times a certain label appeared in all the issues created that month.
We have customers and bug/incident type definition in the labels so i am trying to figure it out what is the type of bug/incident most reported for every month. Also by customer what was the bug/incident type most reported from that customer.
For example I have in the labels field the following values for an issue: “home_depot_usa”, “bug_selector”, “bug_url”
Thanks for the advice here!
Hi Sebastian,
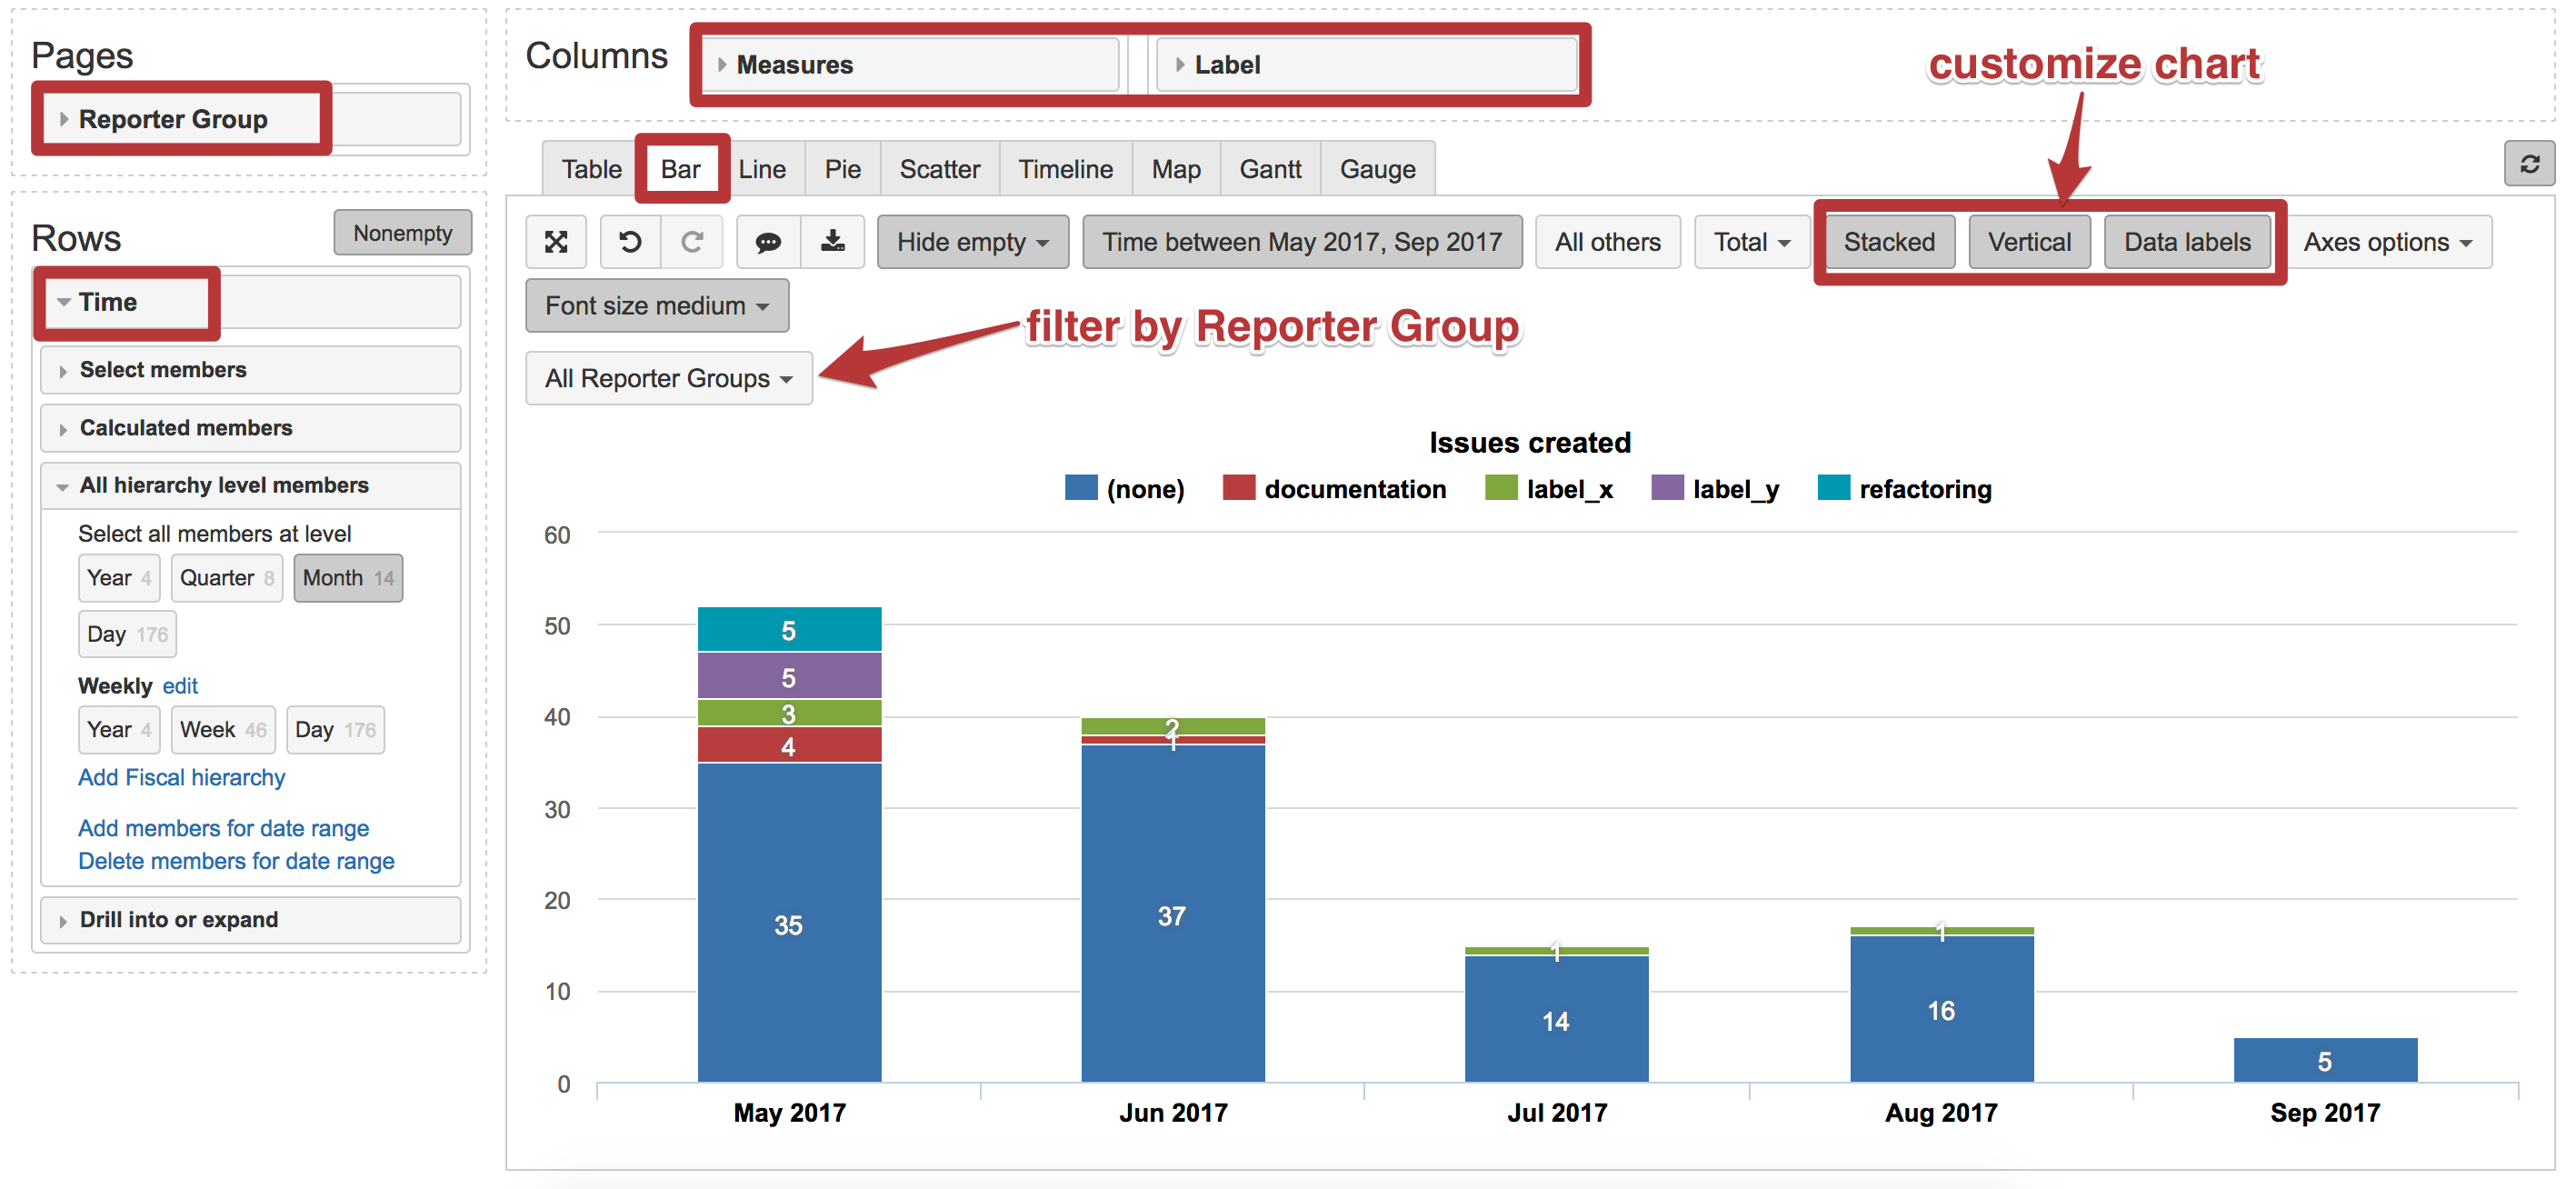
You may have a timeline of created issue amount represented by labels.
- Set “Time” dimension as rows and select hierarchy level Month.
- Set “Label” dimension and measure “Issues created” as columns.
- Select Bar chart view. And customize it to represent data as you like.
You may set to represent data vertically, stacked and show data labels for each bar (number of issues).
Your report may look like in the picture below:
I do not know how you are representing customer information into your eazyBI account (custom field with customer name, groups of particular users or some other indication). However, you may analyze data by issue reporter or other dimensions.
For example, you may set “Reporter Group” dimension as pages and use it as a filter to get the report for each of reporter groups.
Best,
Zane Baranovska / support@eazybi.com
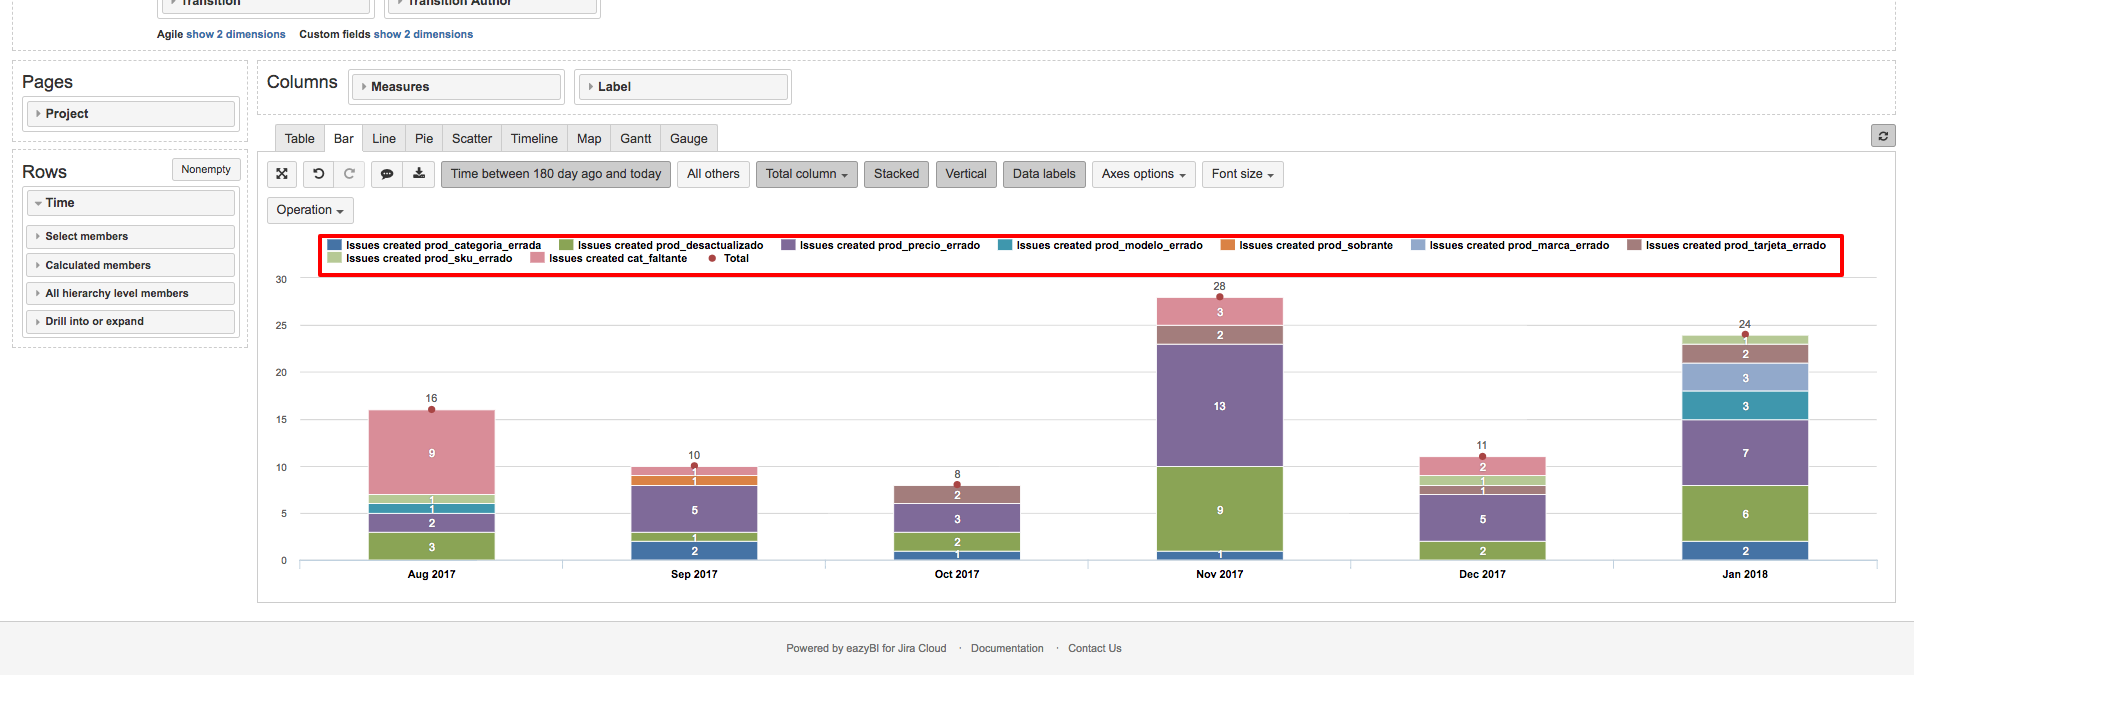
Thanks @zane.baranovska for the quick response!
I have in the same labels for now our customer info. and i am struggling to get that data (our app or zendesk) in jira within a customized field.
Any thoughts to have this report like the one you posted, it is like you have under the “issues created” title all the labels names and colours. I tried but instead i get the “Issues Created label_x” “Issued Created label_y”.
Report is attached.
Regards,
Sebastian
Any thoughts on my question above @zane.baranovska?
Thanks,
Sebastian
Hi Sebastian,
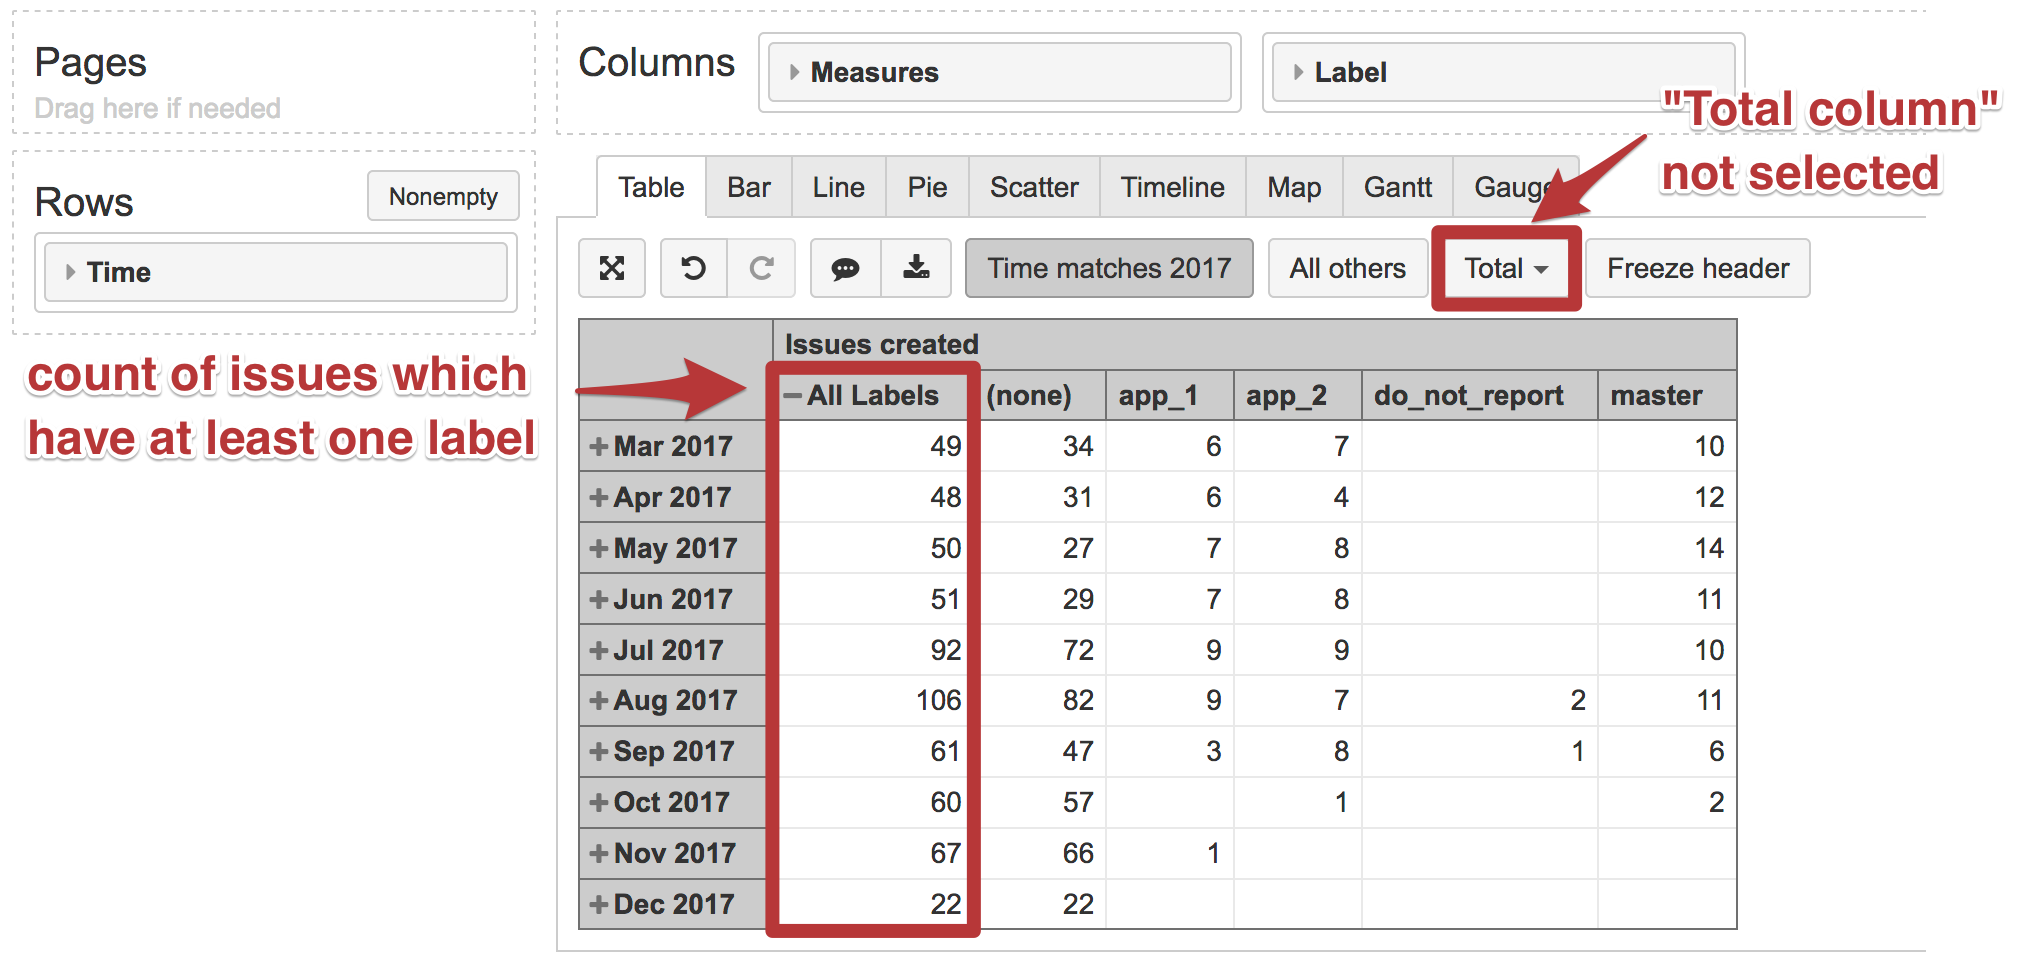
You are using option Total column, and it causes the repetition of measure name.
Alternative solution.
You may use Label dimension top hierarchy member All Labels to get a count of issues which have any label in a selected period (see pictures below).
Note though, All Labels may return slightly different amount than Total column as labels are multiselection field in Jira, and one issue may have more than one label at the time.
Best,
Zane Baranovska / support@eazybi.com